
Inside NeurIPS 2025: The Year’s AI Research, Mapped
Using Cohere's Command A Reasoning and Embed 4 to Visualize the ~6,000 Papers Accepted to NeurIPS 2025

NeurIPS 2025 papers are out—and it’s a lot to take in. This visualization (best viewed on a computer, not mobile) lets you explore the entire research landscape interactively, with clusters, summaries, and LLM-generated explanations that make the field easier to grasp.

The visualization heavily uses Cohere’s generation and embedding models and a workflow described below to explore such large text archives. The data is ultimately plotted with datamapplot with some customization.
Exploring the frontier is vital—despite information overload
NeurIPS is known as one of the leading machine learning conferences at which some of the top research is presented. Having attended several, the experience can be challenging in several ways:
In a field that moves as fast as ML, the field often evolves between the May submission deadline and the December conference. Exploring papers earlier helps.
It is overwhelming in size and magnitude. We need better tools to reduce the information overload. Intentional use of AI and visualization can help here.
Outside of your own domain, work in other domains can often be hard to decipher. An LLM can explain in lay terms.
Over the last few years I’d often build simple interactive visualizations that help explore these papers. And since the accepted papers list was just announced, here’s that visualization so you can explore it for yourself.
A guided tour of the visualization
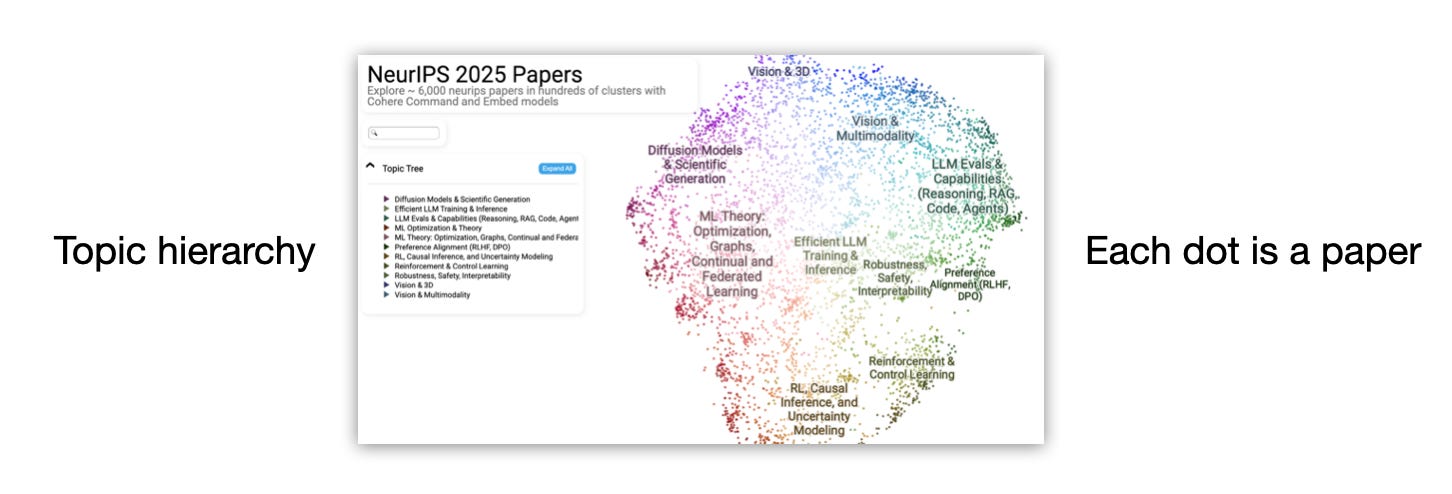
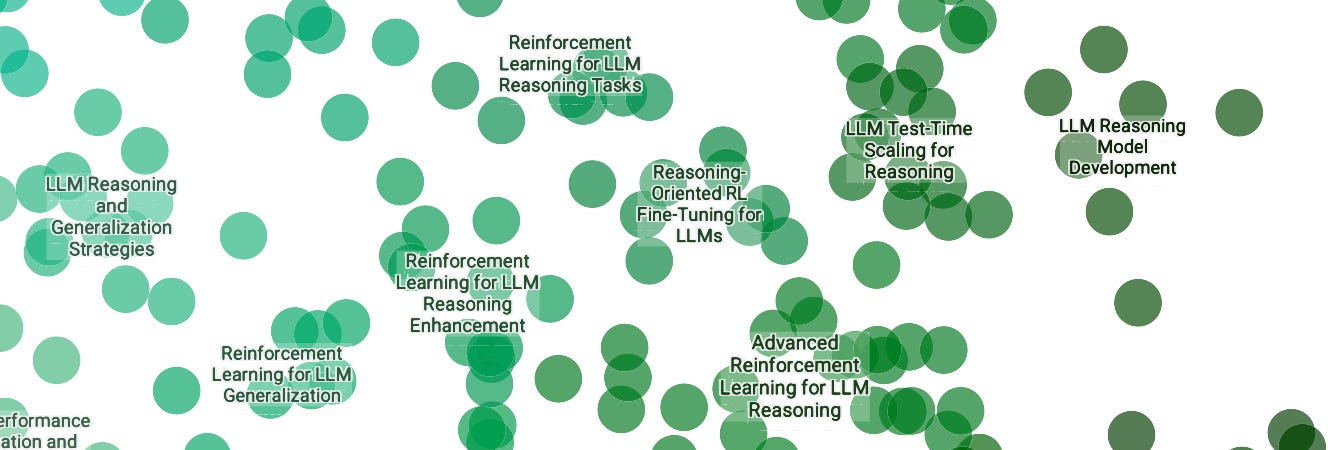
Zooming in reveals the names of smaller, more fine-grained clusters. We can also expand the top-level categories to reveal the major clusters inside of them. Clicking on a cluster name from the topic tree focuses the plot on that cluster. An LLM proposes cluster names, which I then revise.
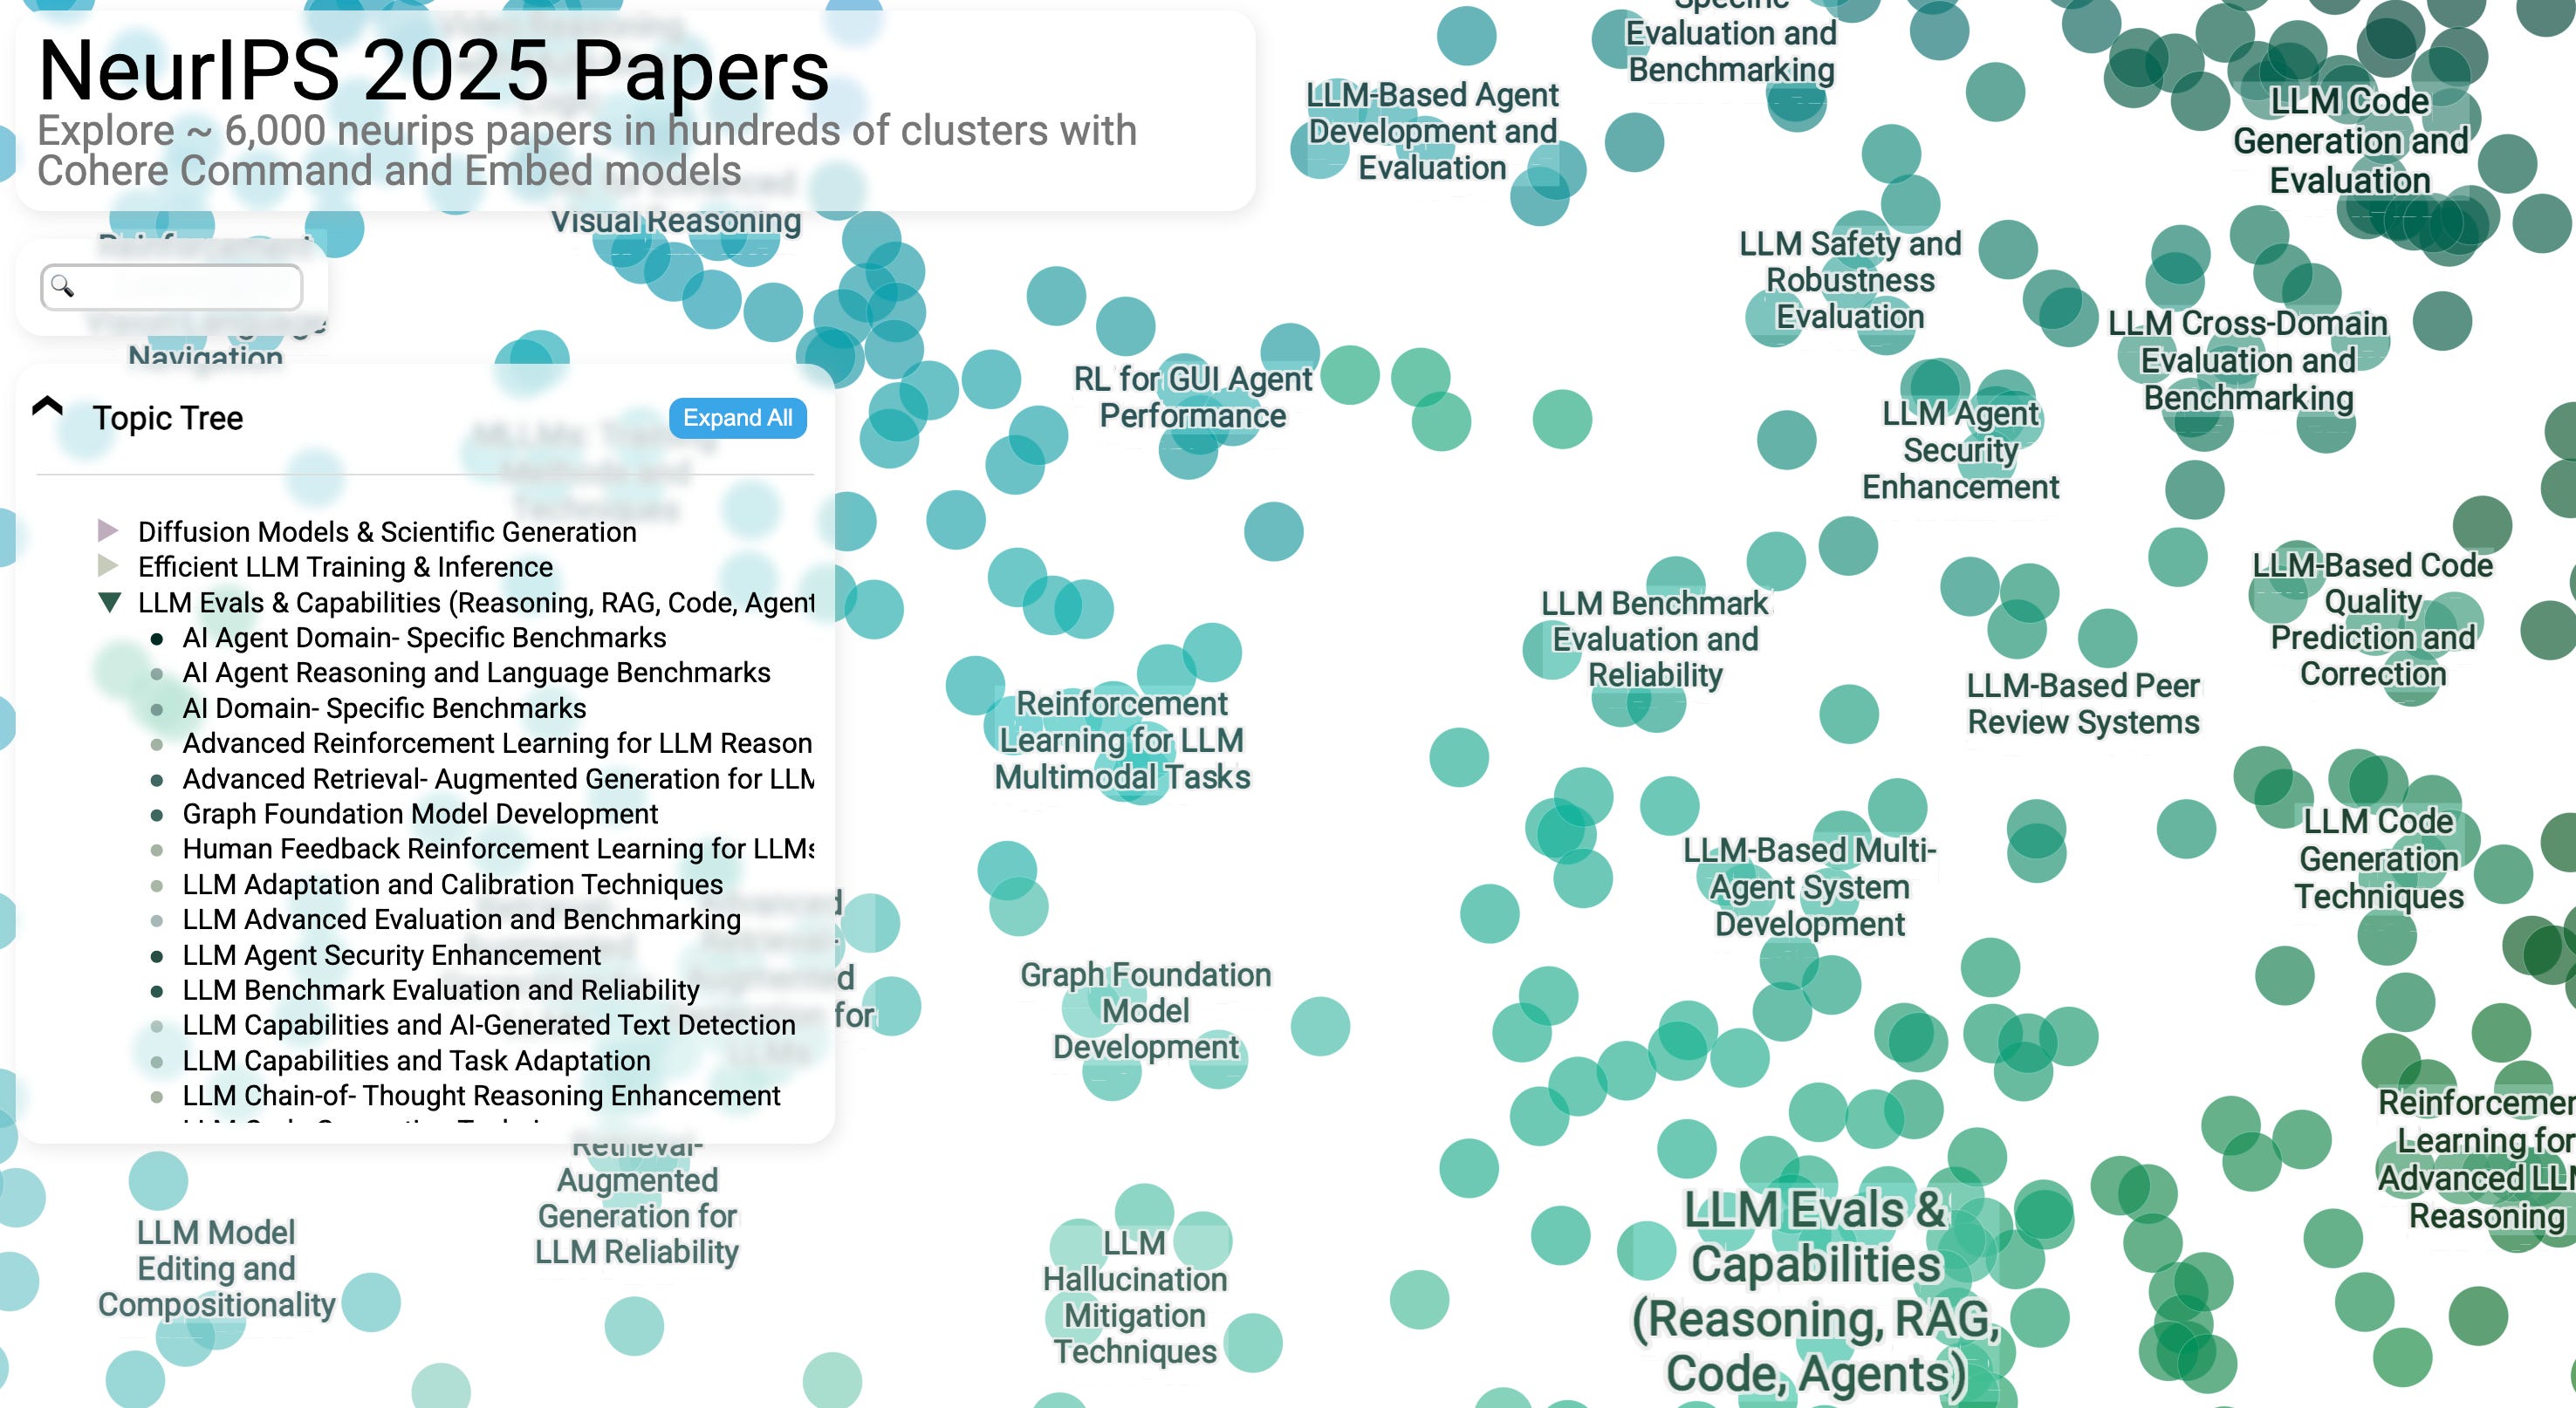
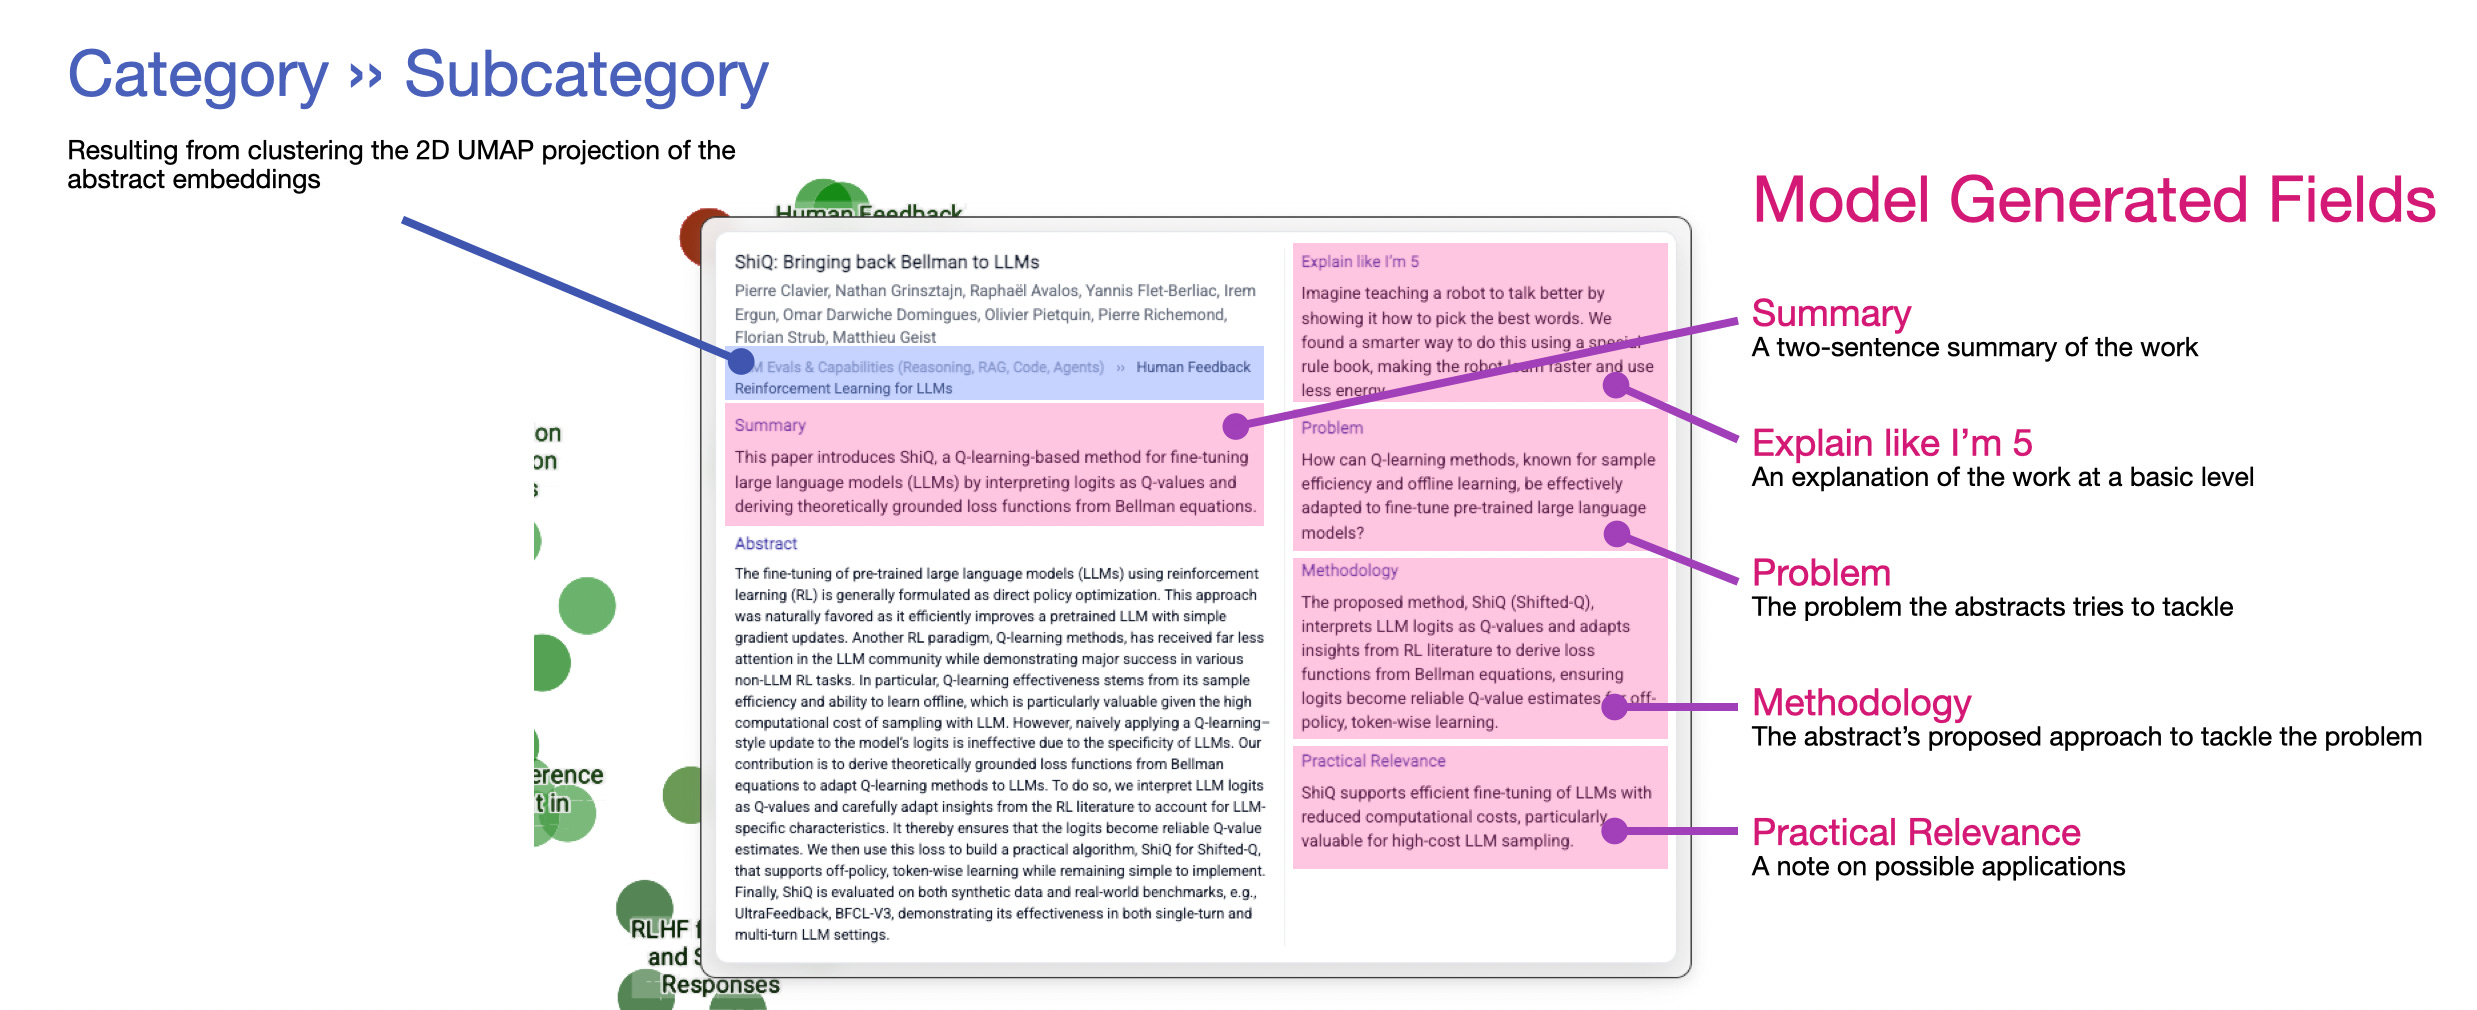
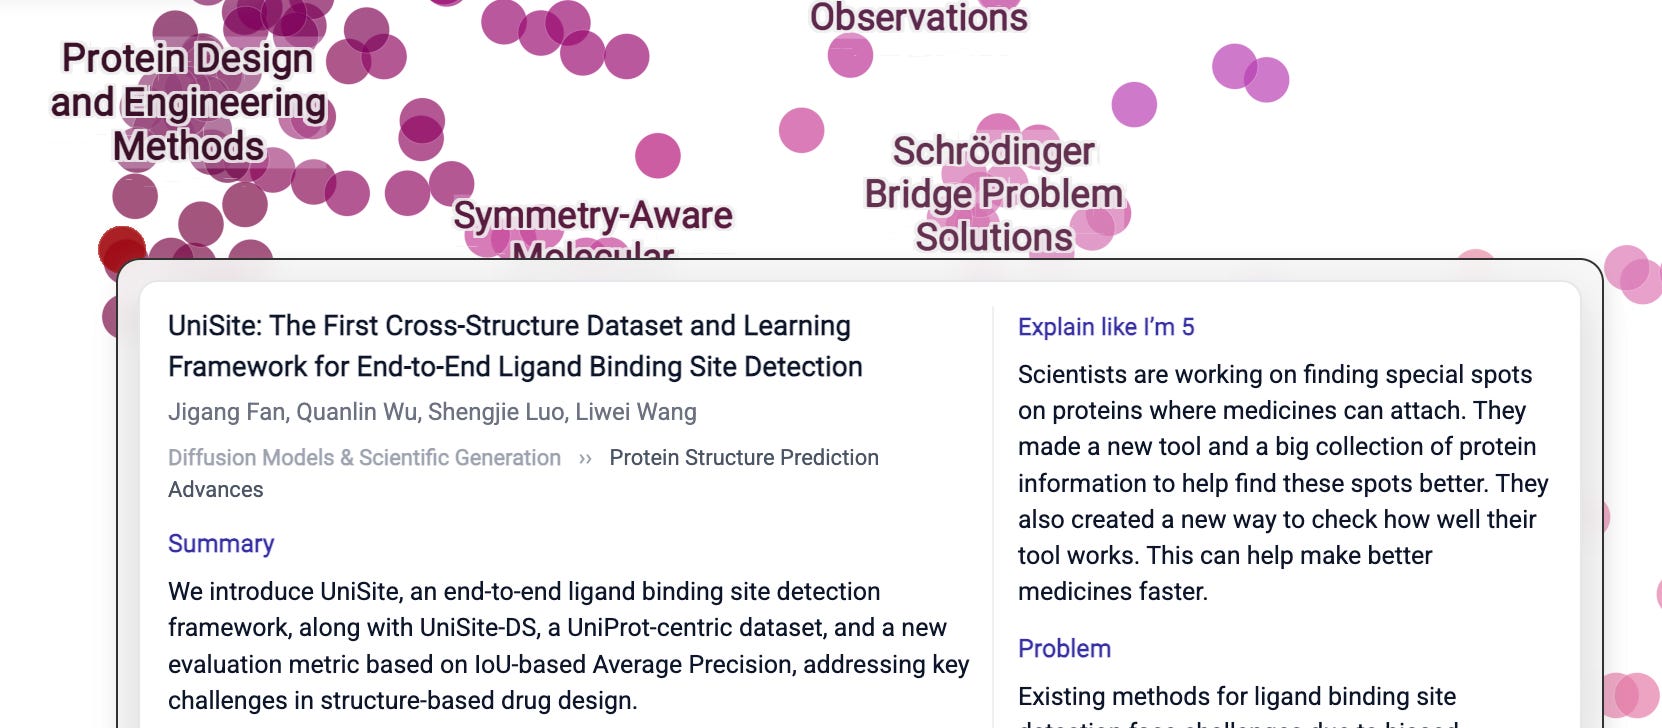
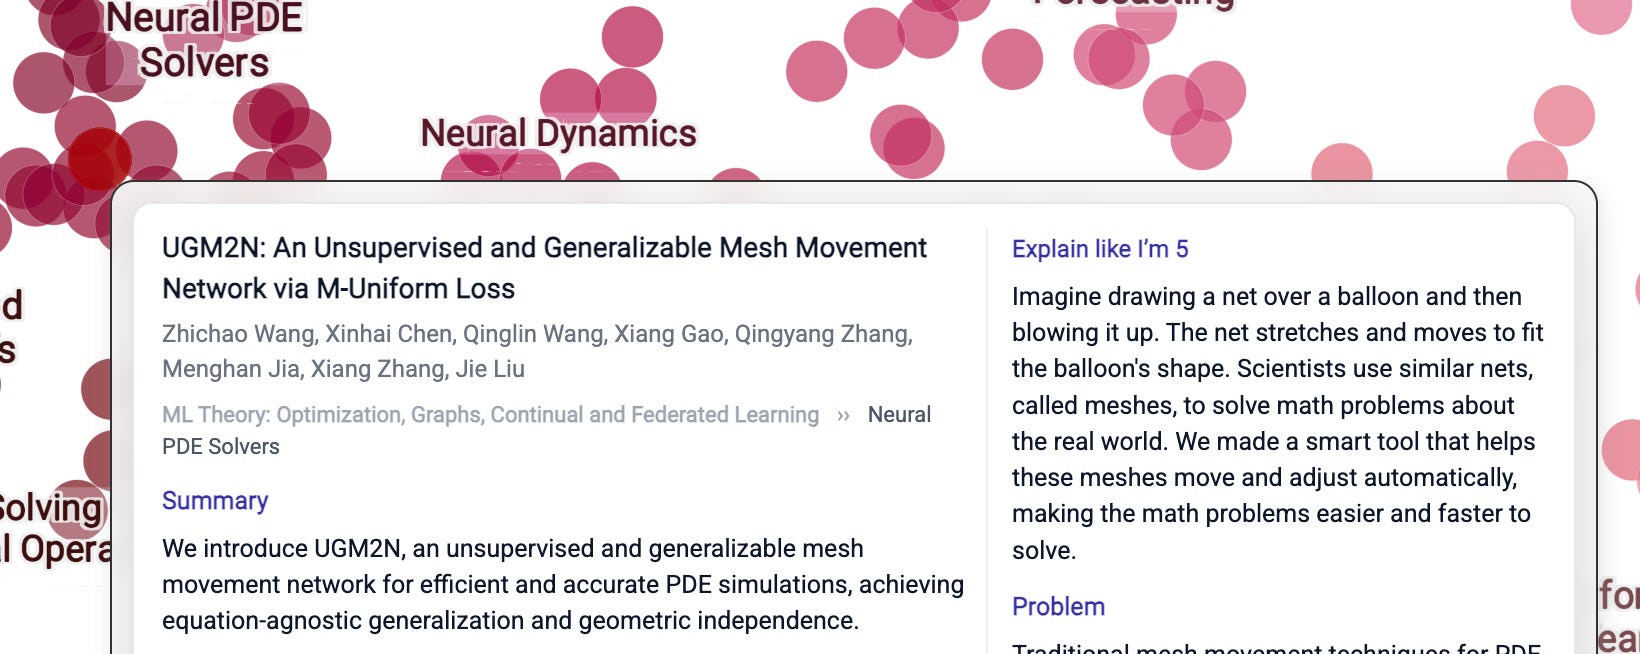
Hovering over a paper reveals information containing the paper’s title and abstract. But I’ve always wanted the model to do some work on this text as well, so you’ll see an LLM extracted summary, problem statement, and methodology, plus an explanation for a five-year-old which turned out to be my personal favorite section especially as I switched to explore domains outside of my immediate focus.
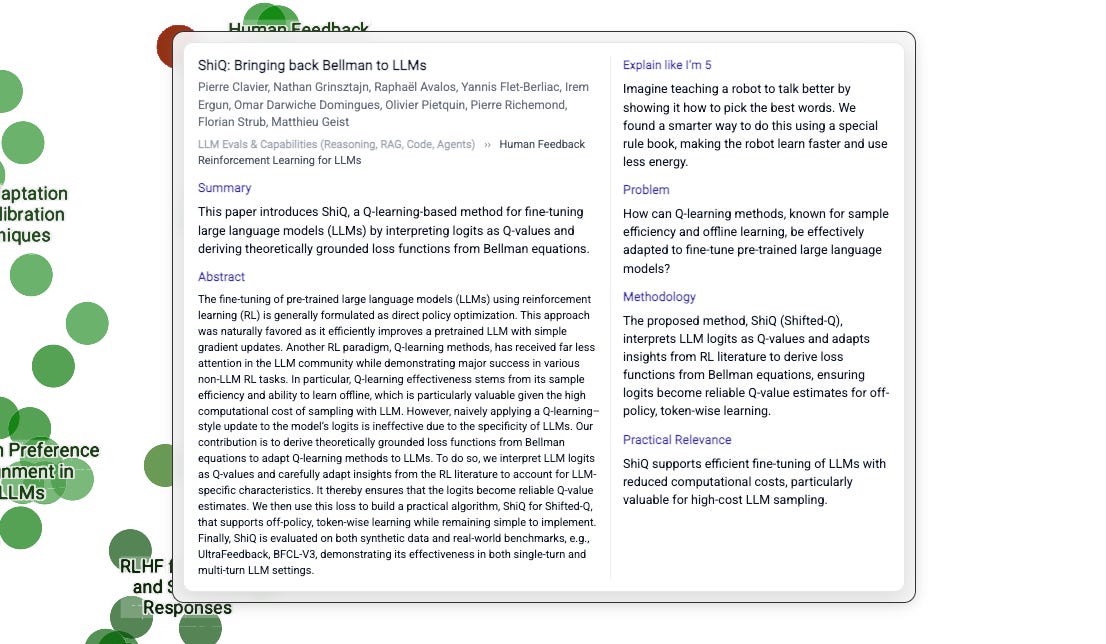
The tooltip presents the abstract as well as other sections that help break it down.
Conference observations
Largest Themes: LLMs, Multimodality, and Reinforcement Learning
These three stand out to me as the biggest groups. Not only as major clusters, but they also tend to constitute parts of other clusters (I also run a multi-label classification step, so a paper isn’t limited to a single cluster). By my calculation, about 28% of the papers include multimodality as a primary focus, and 13% include reinforcement learning as a primary focus (and those can overlap). Also at 13%, I’m seeing Evaluation papers and Reasoning papers.
A spike in LLM reasoning research. Reasoning was the major topic of discussion in the corridors of NeurIPS 2024 due to the recent release (at the time) of the O1 models. This interest is echoed in the accepted research as expected. I’m seeing about 766 papers with reasoning as a core focus.
Diffusion joins LLMs and Reinforcement Learning as one of the major themes of the conference.
The top part of the space is predominantly computer vision and multimodality, with its western region exploring lots of different aspects of diffusion models.
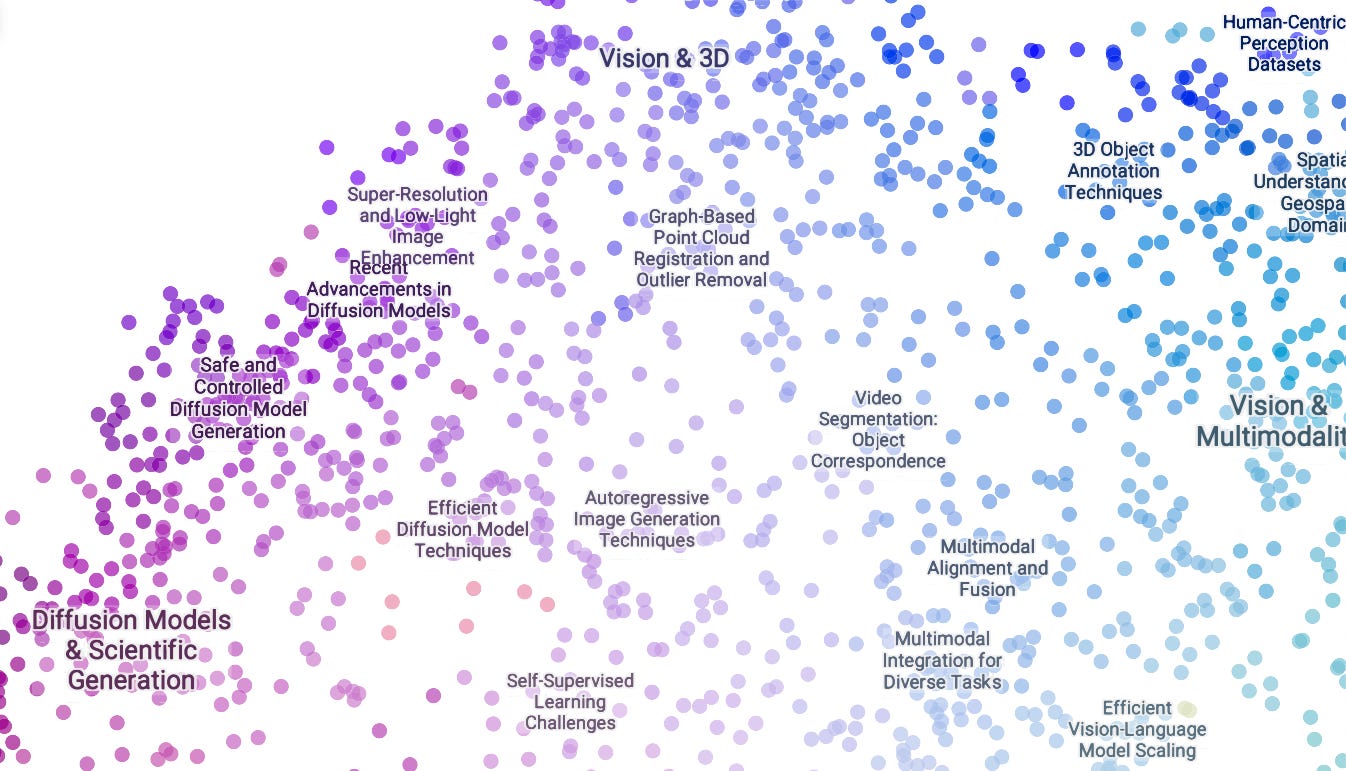
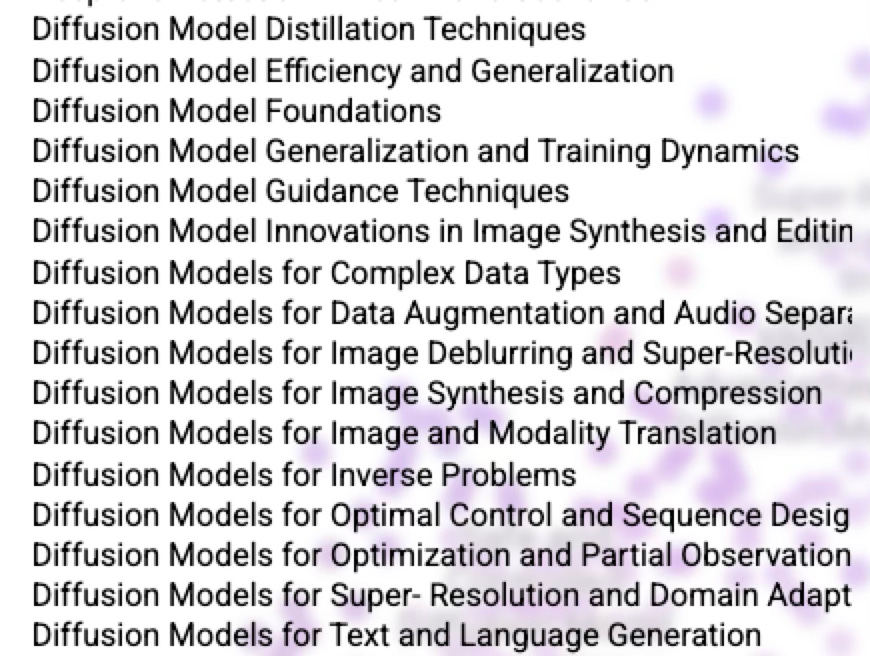
The topic tree echoes this with multiple major clusters on diffusion
Over in science land, I’m really grateful for ELI5. I do see myself spending a few days just reading these. I find that my process is to read the summary, and if I don’t understand it, I’d revisit it after reading the ELI5, and it’s often helpful.
Here are a couple of examples where it feels the AI is hugging your brain and helping it absorb information it may otherwise find to be obscure. I absolutely adore this use case and its potential to extend the human mind.
Another example:
AI Should Extend The Human Mind
In this approach, we’re intentionally pointing the AI at many sub-problems to make reading this collection of text easier.
Individual text analysis
Some of these steps apply at individual item level, and some of them are applied to groups (clusters) to help us navigate our way through the collection.
Text extraction
Classification
Question answering
Summarization
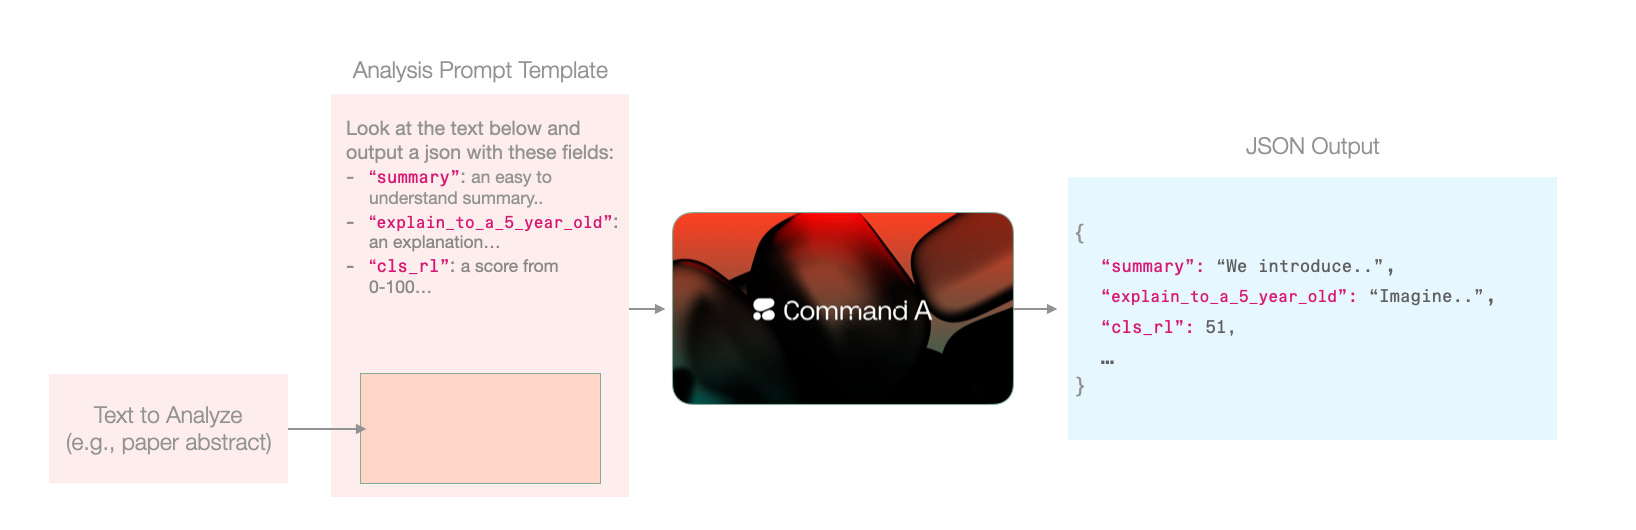
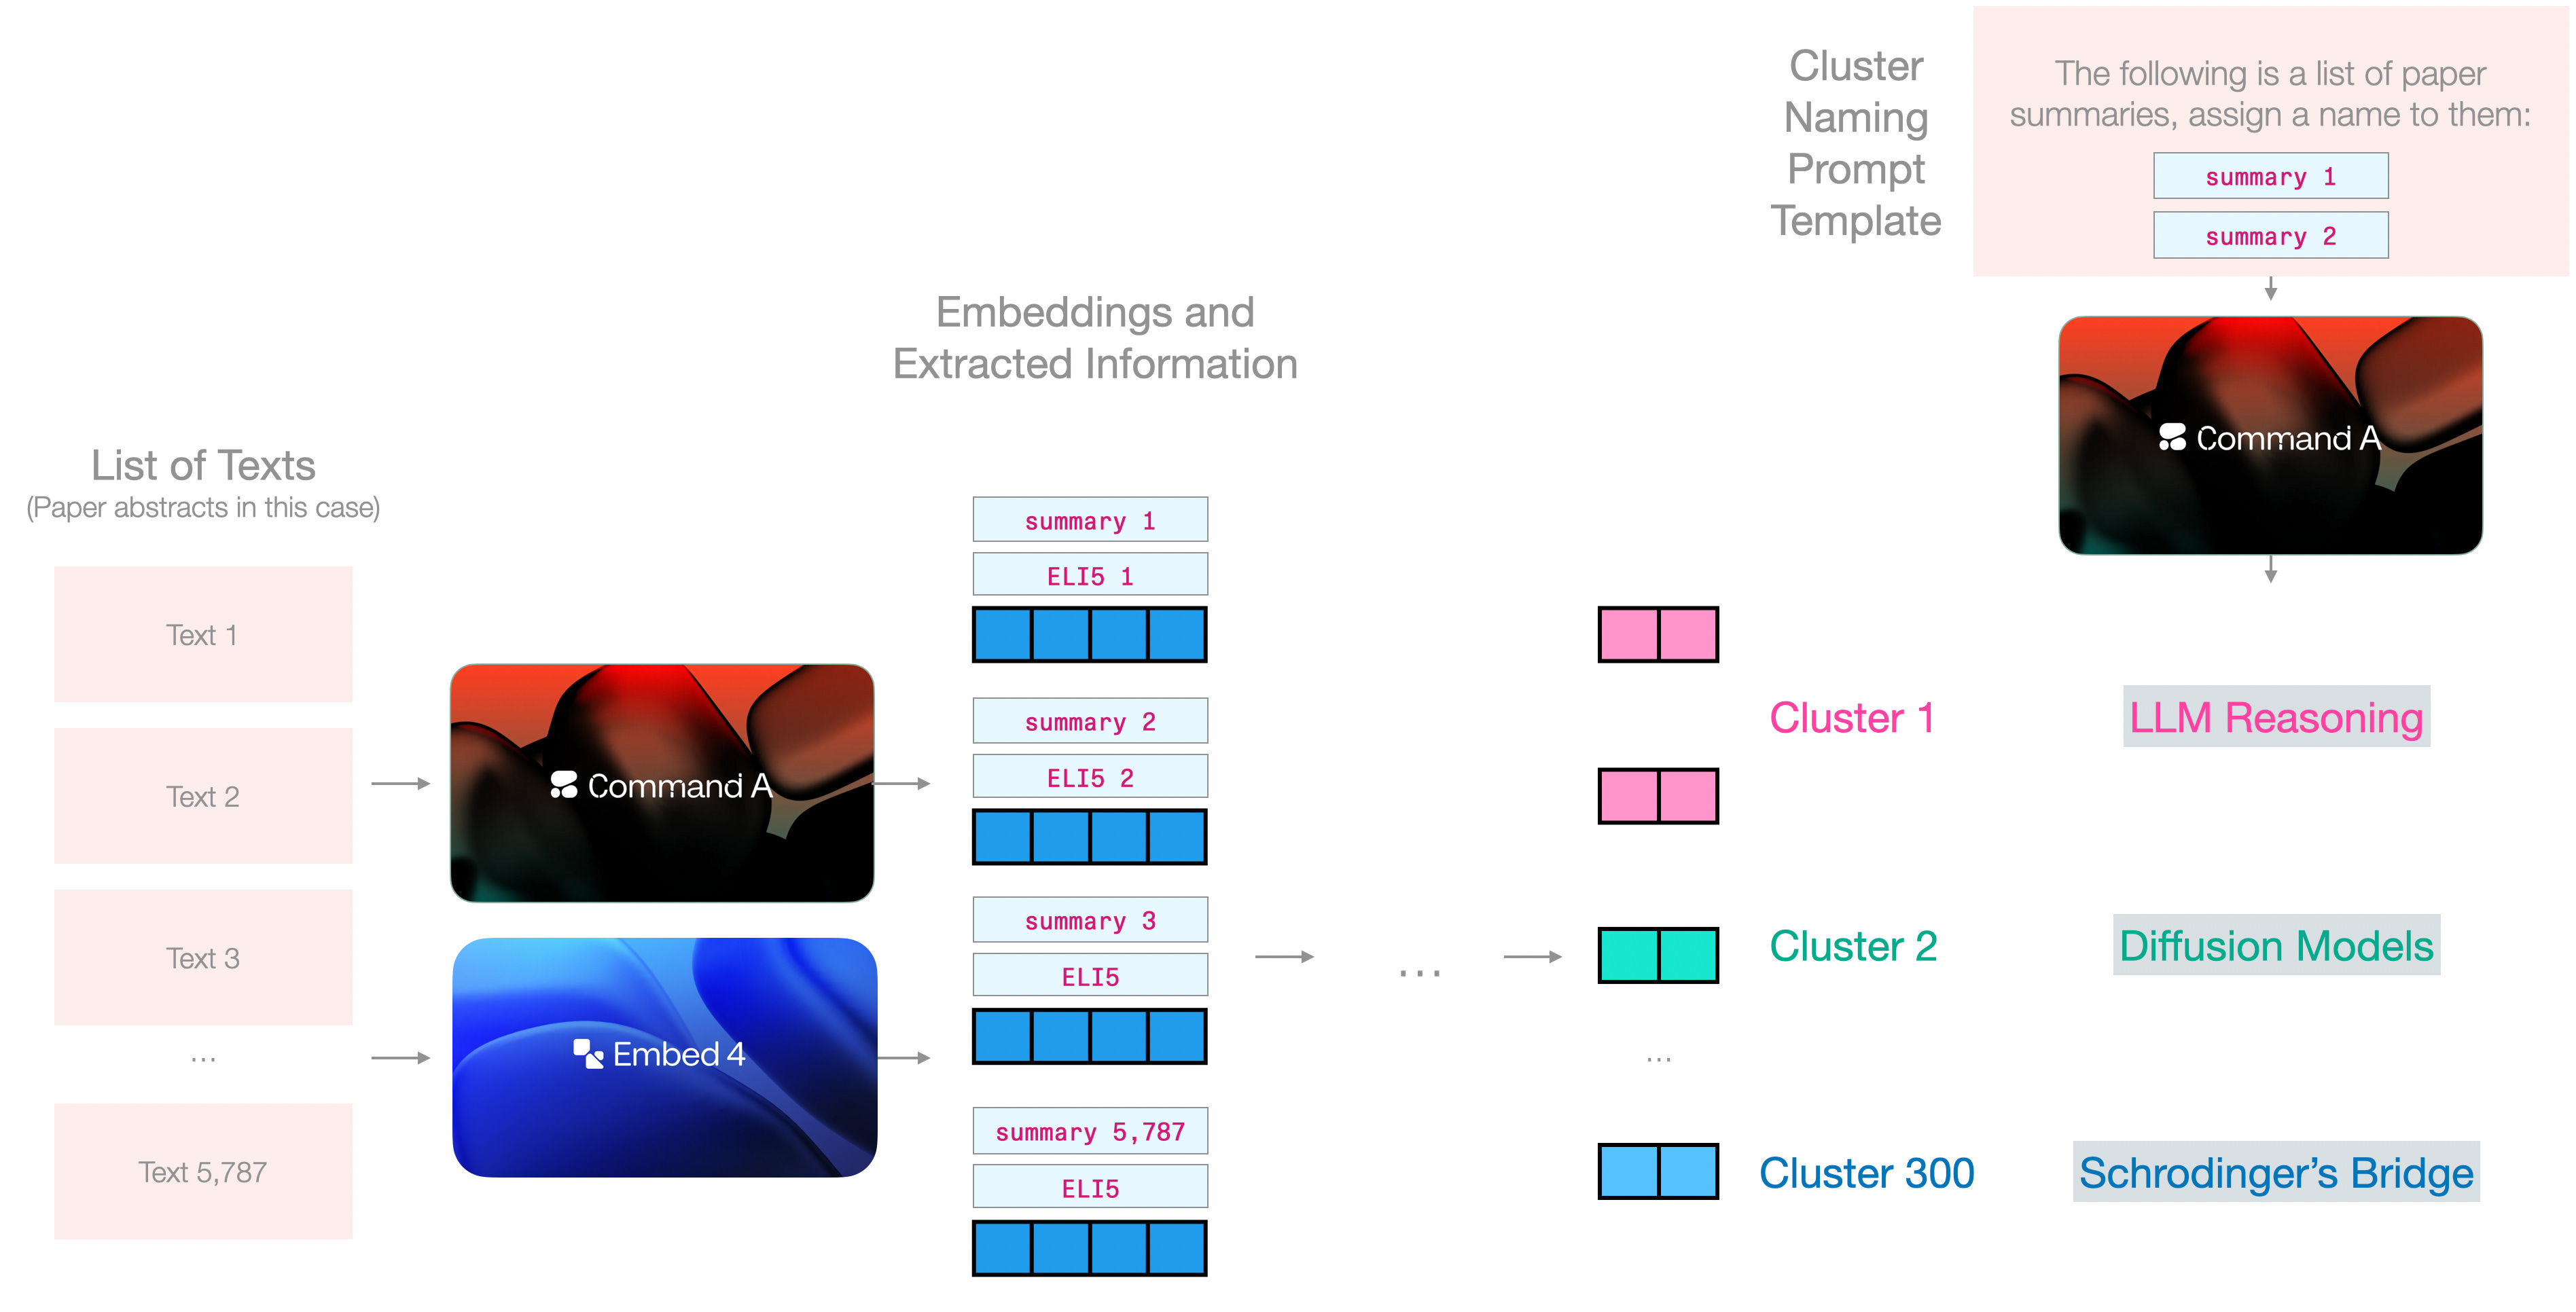
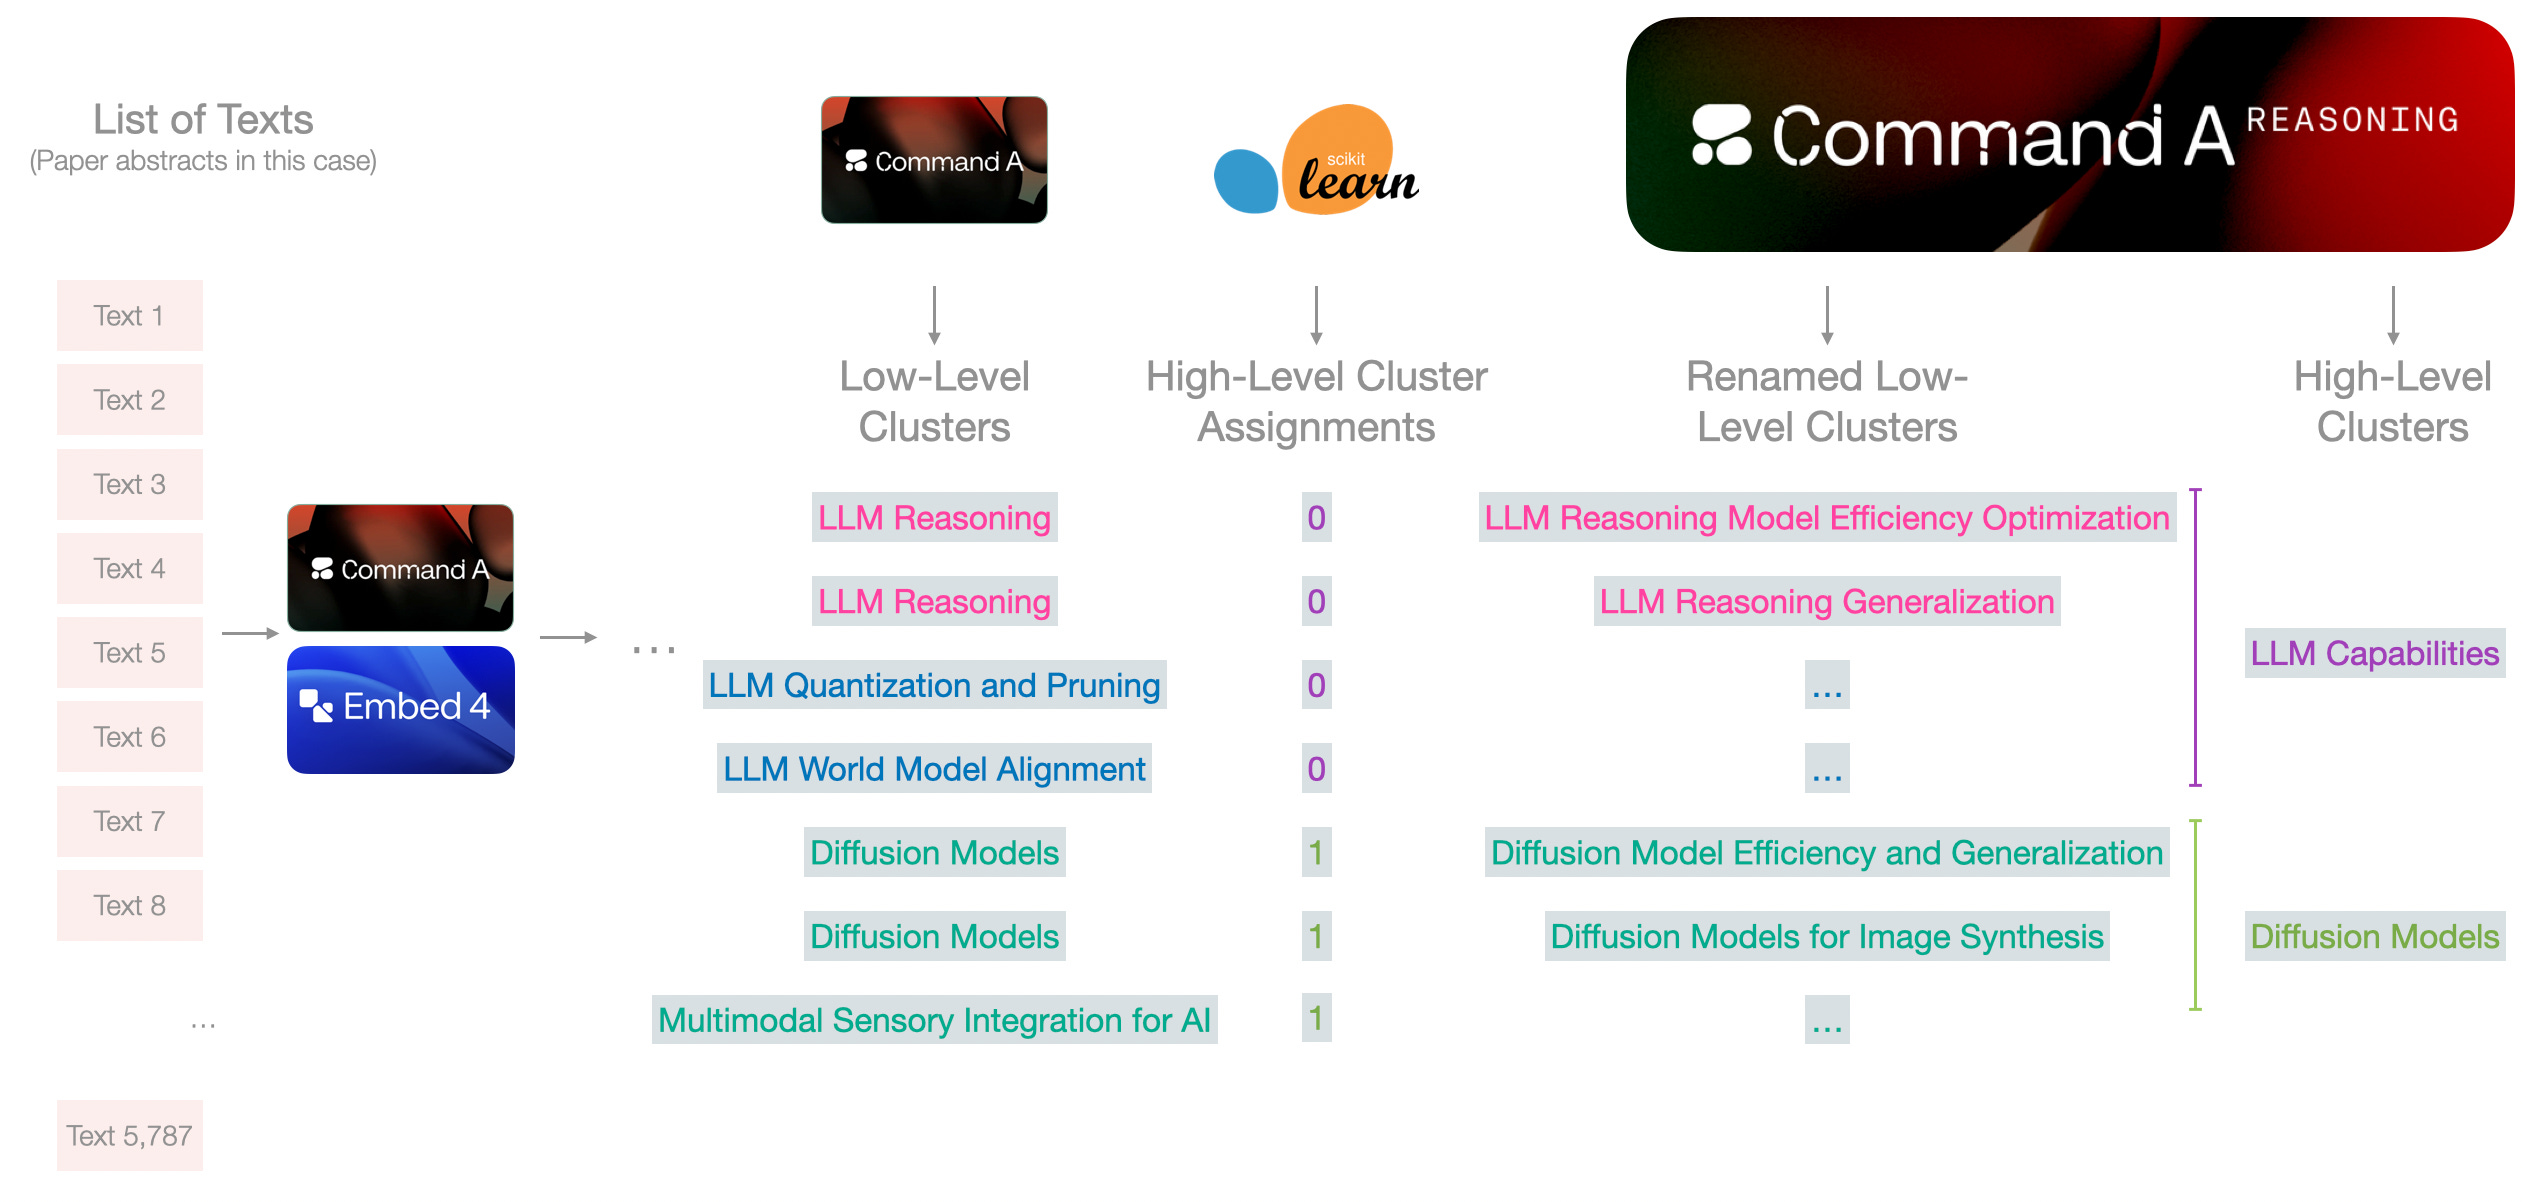
The great thing in text-to-text models is that we can do all of these in a single step. We simply prepare a prompt template, and inject each text in that prompt, ending up with 5,787 prompts (one per paper accepted in the conference).
Running thousands of prompts is one of the superpowers you do not get to use if all of your LLM usage is through a playground. It’s probably not even wise yet to delegate to many agents given the possible costs involved. So these are often run as individual scripts, or as workflows and in both cases triggered intentionally by a human.
Clustering into many small groups
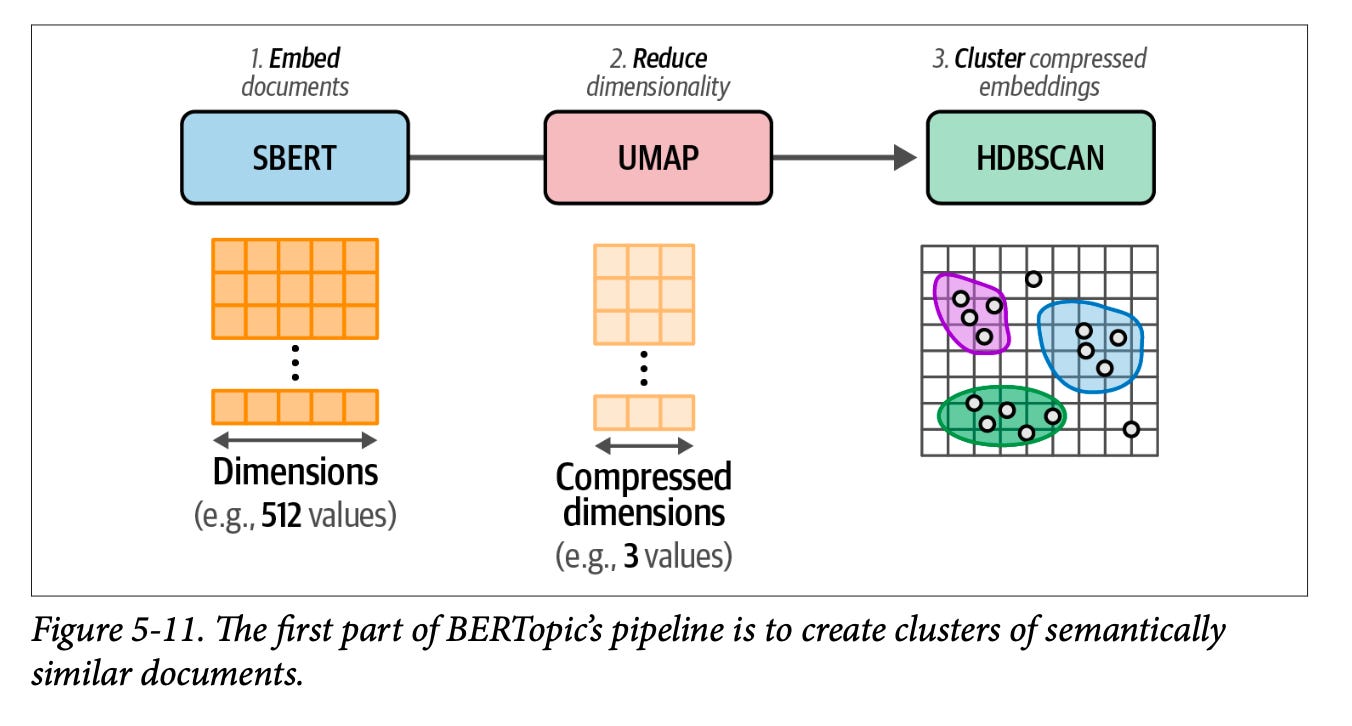
Three years ago, I wrote Combing For Insight in 10,000 Hacker News Posts With Text Clustering, which described a process very close to the one I used here. We can see that process in this figure:
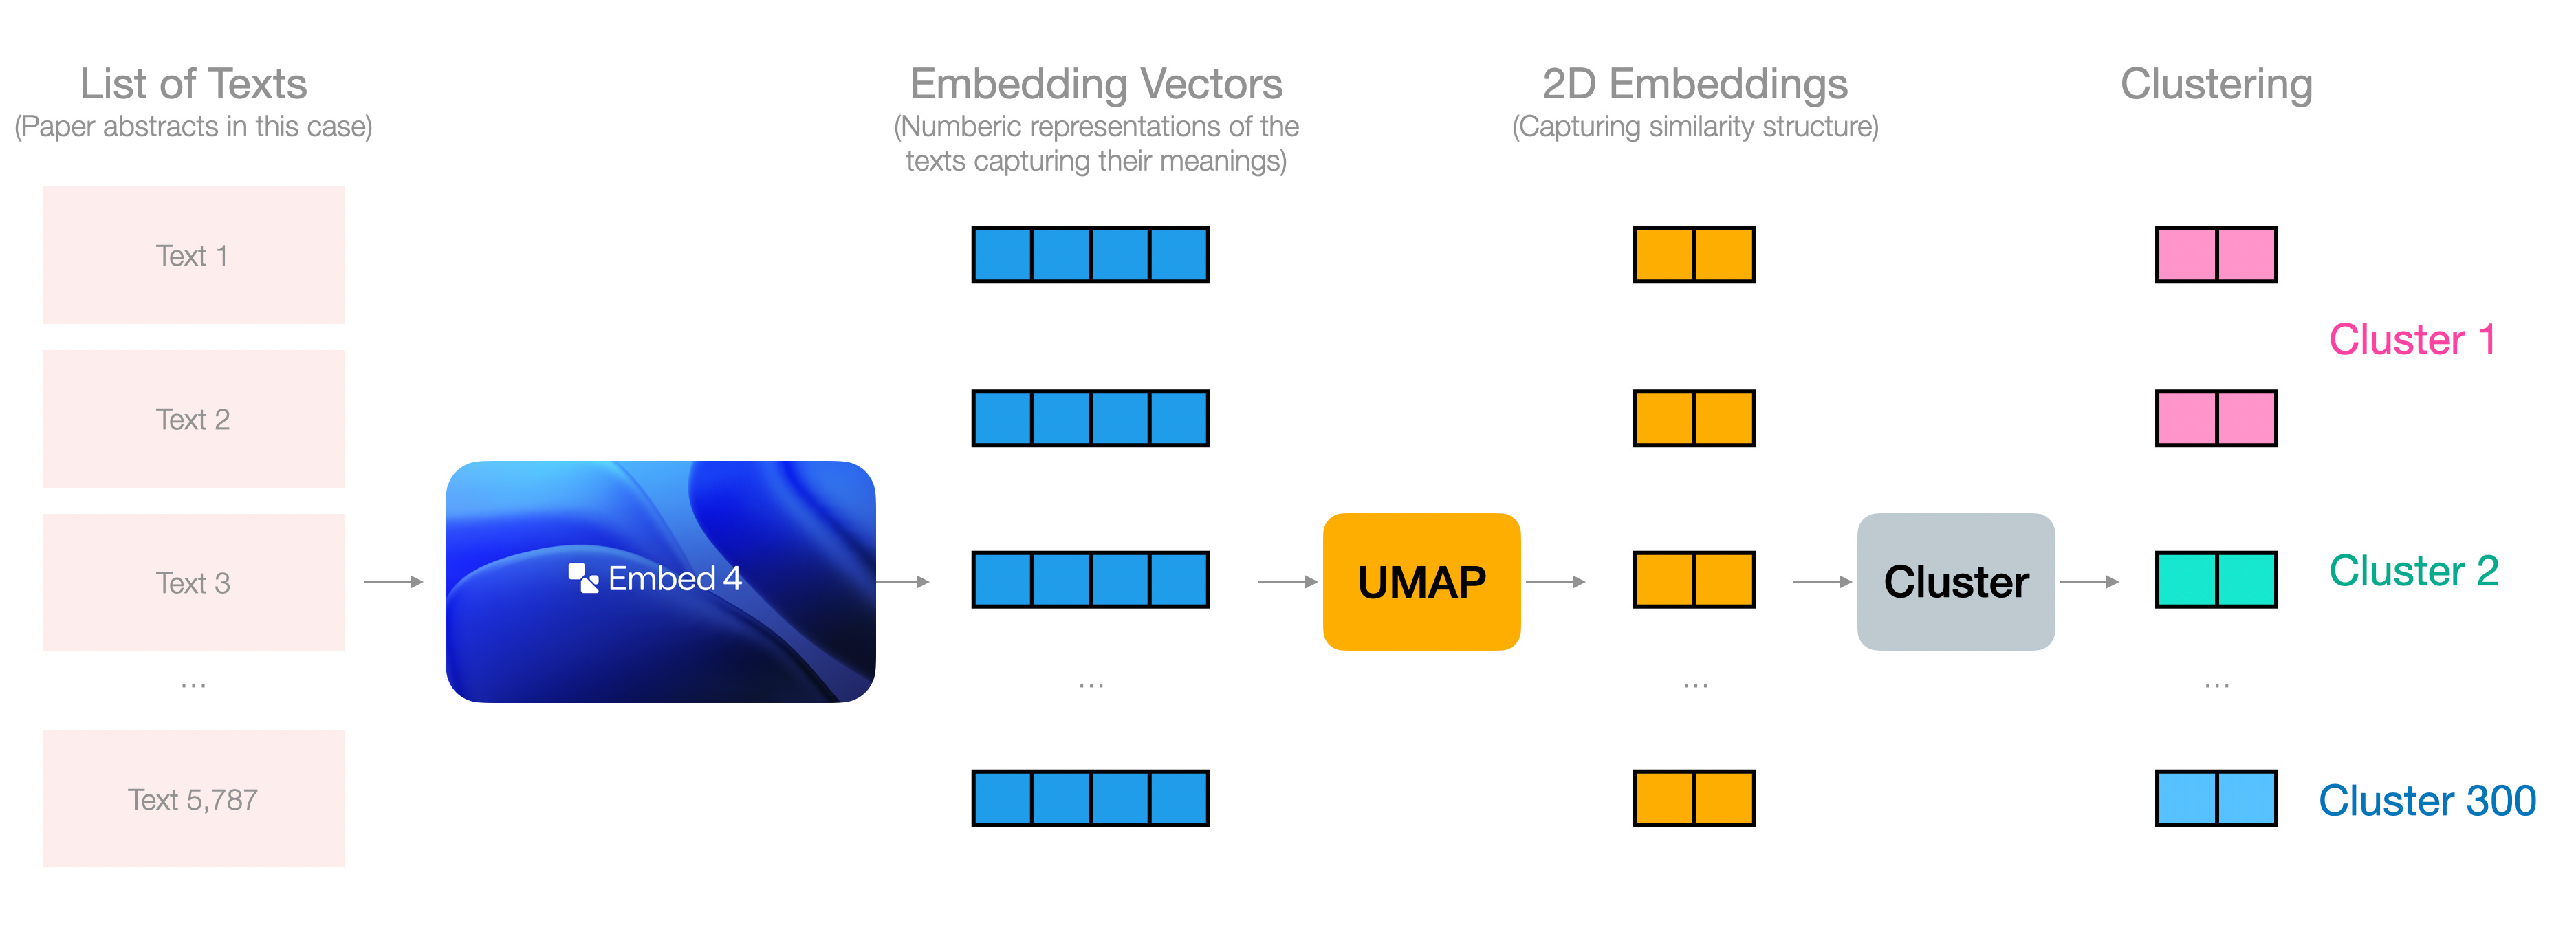
The abstracts are embedded, then reduced to two dimensions with UMAP, then clustered with K-Means into many clusters. These clusters are later presented to a model to assign cluster names.
Now, the UMAP step dramatically reduces the size of the embeddings and a lot of the information is lost. We’re okay with that in this scenario because the coherence of the plot is a high priority (e.g., the clusters are actually grouped together). In other scenarios, we might choose to either cluster the embeddings directly, or reduce them to an interim embedding size.
You can read a lot more about these flows in Chapter 5 of our book, Hands-On Large Language Models.
Clustering (the small clusters) into a few larger clusters
Let’s switch to plot these vectors so we can see the effect of the clustering more clearly.
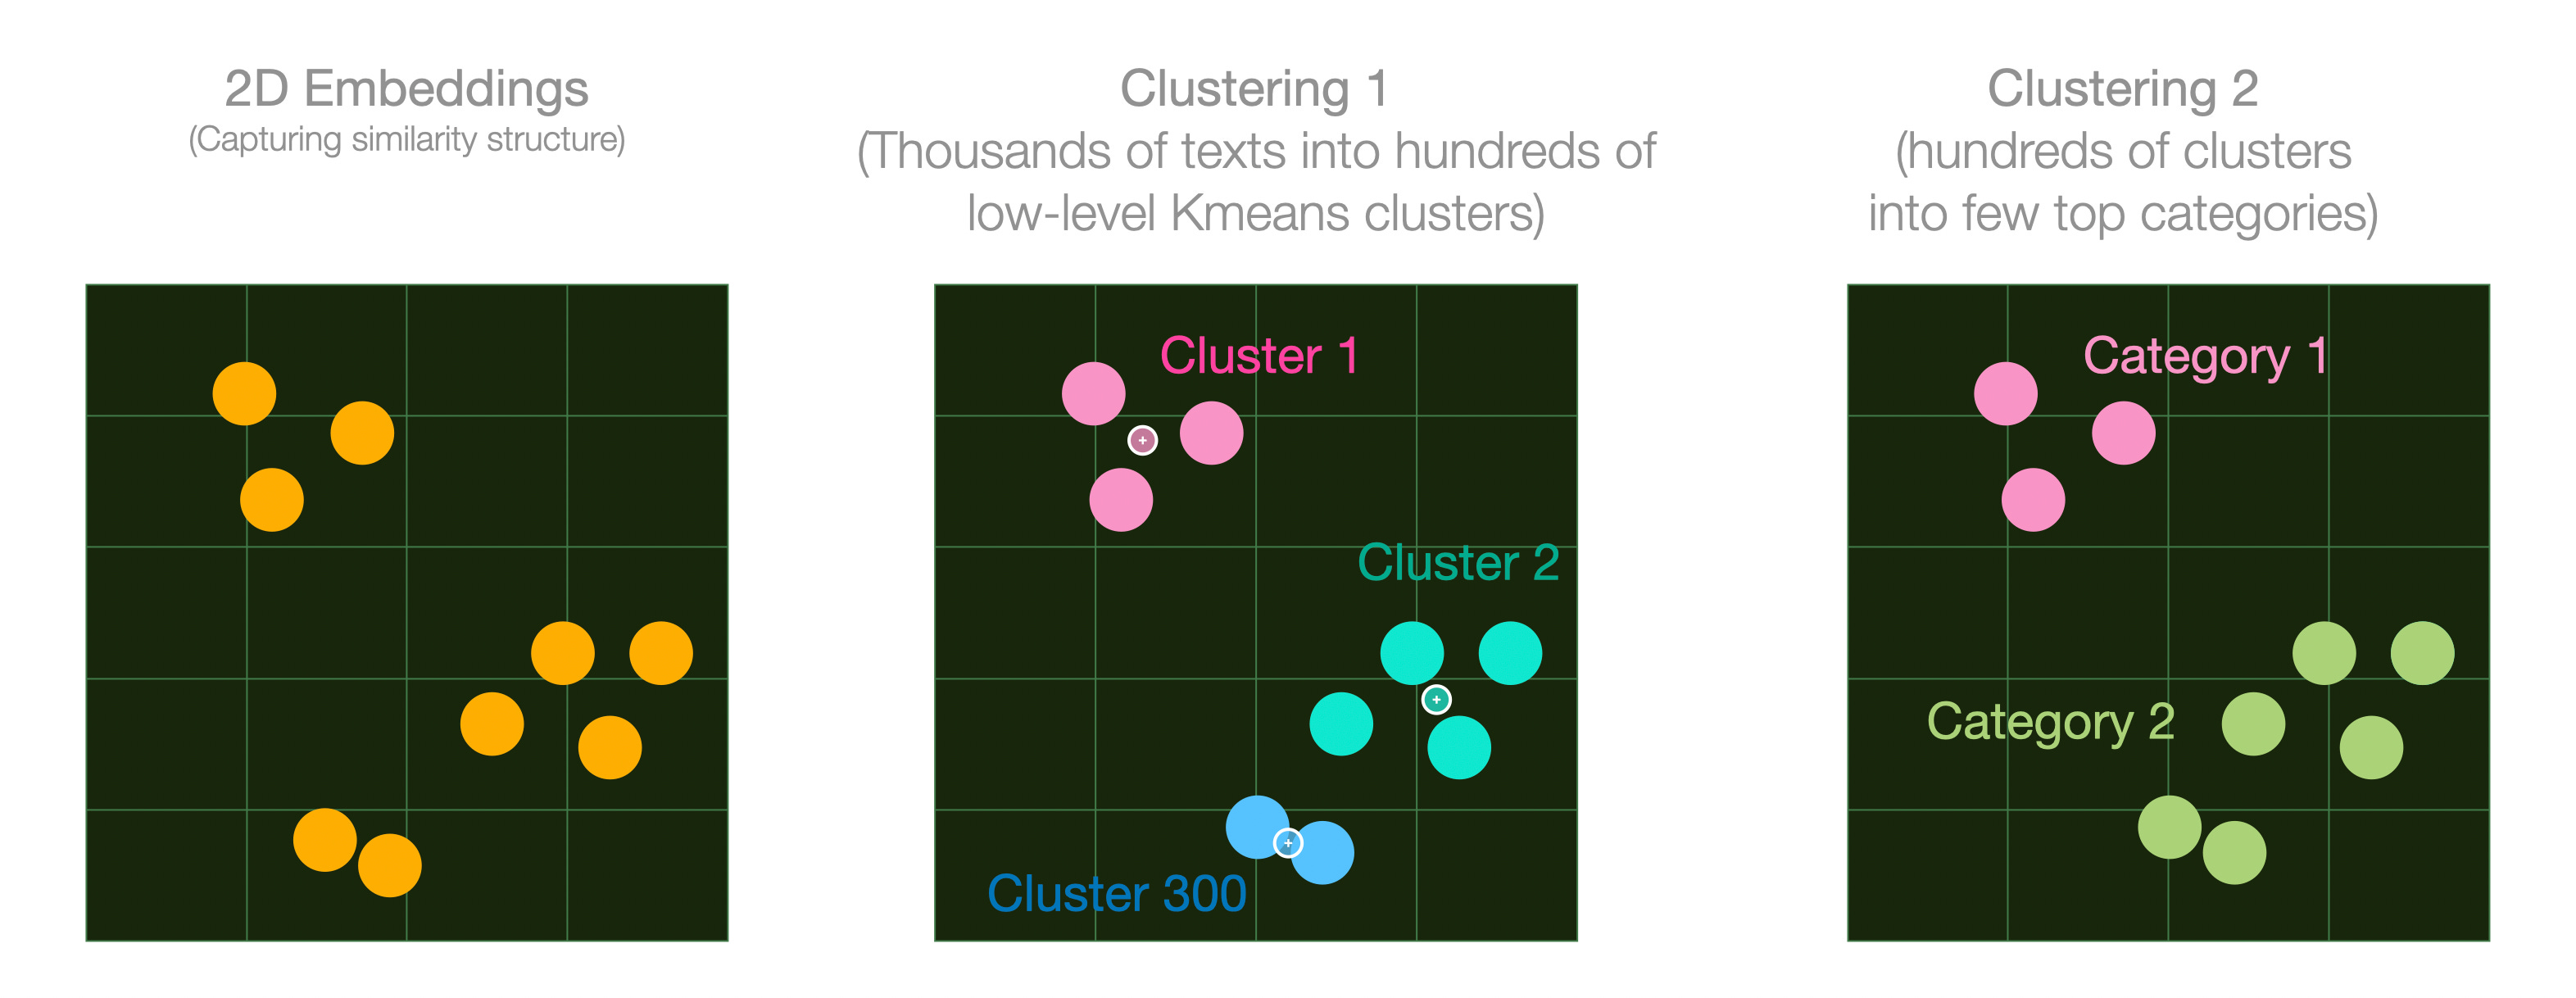
The small circles in the second grid are cluster centroids. They are produced as a part of the K-Means clustering algorithm. We can then cluster those centroids to produce a higher level clustering for, say, 10 top-level categories.
This already adds a lot of information to the plot. But we can reveal a lot more information if we assign meaningful names to the clusters.
Cluster name assignment
Now we can start to see embeddings and generation models working together. Given the embeddings clusters, and the summaries of the abstracts, we can present each cluster to the generative model to assign a name to it. We can either use the entire abstracts or the summaries we generated in the previous step.
There are a few naming techniques beyond simply sampling examples from the cluster.
From here, all that remains is plugging this data into the incredible datamapplot, and customizing some of its parameters leading to the final figure.
Context Handoffs and Naming Larger Clusters
One pattern that this workflow highlights is the focus we need to pay to context across pipeline steps. Prompt engineering and context engineering are key areas for working with LLMs, and that extends to LLM processing pipelines.
The cluster names resulting from the previous step could be redundant. So two adjacent clusters could both be called “LLM Reasoning” if the model is fed the papers from that cluster alone.
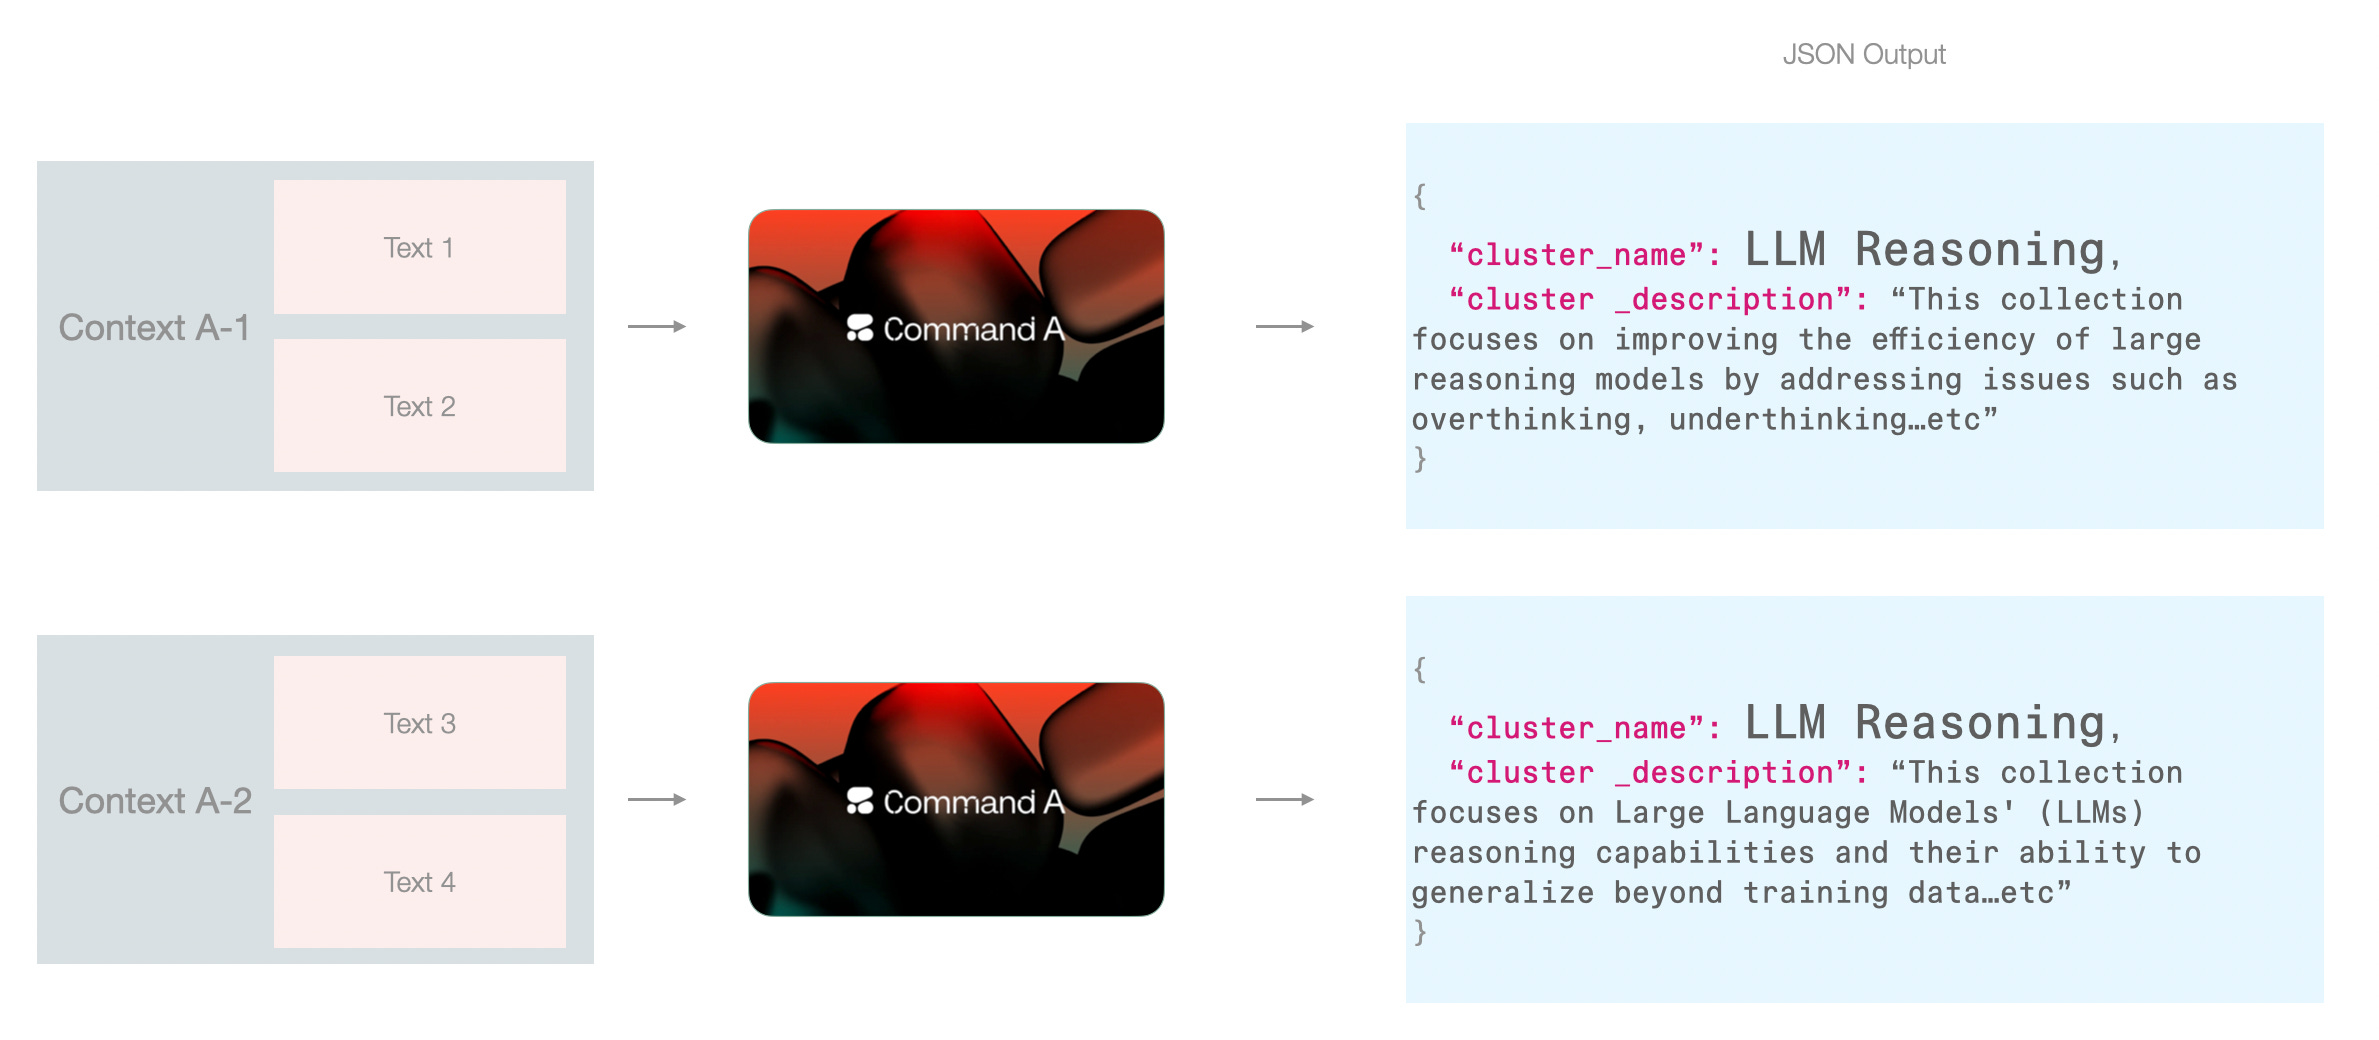
There are a couple of ways around this: one is to pack papers from other clusters and perhaps name all clusters in one go.
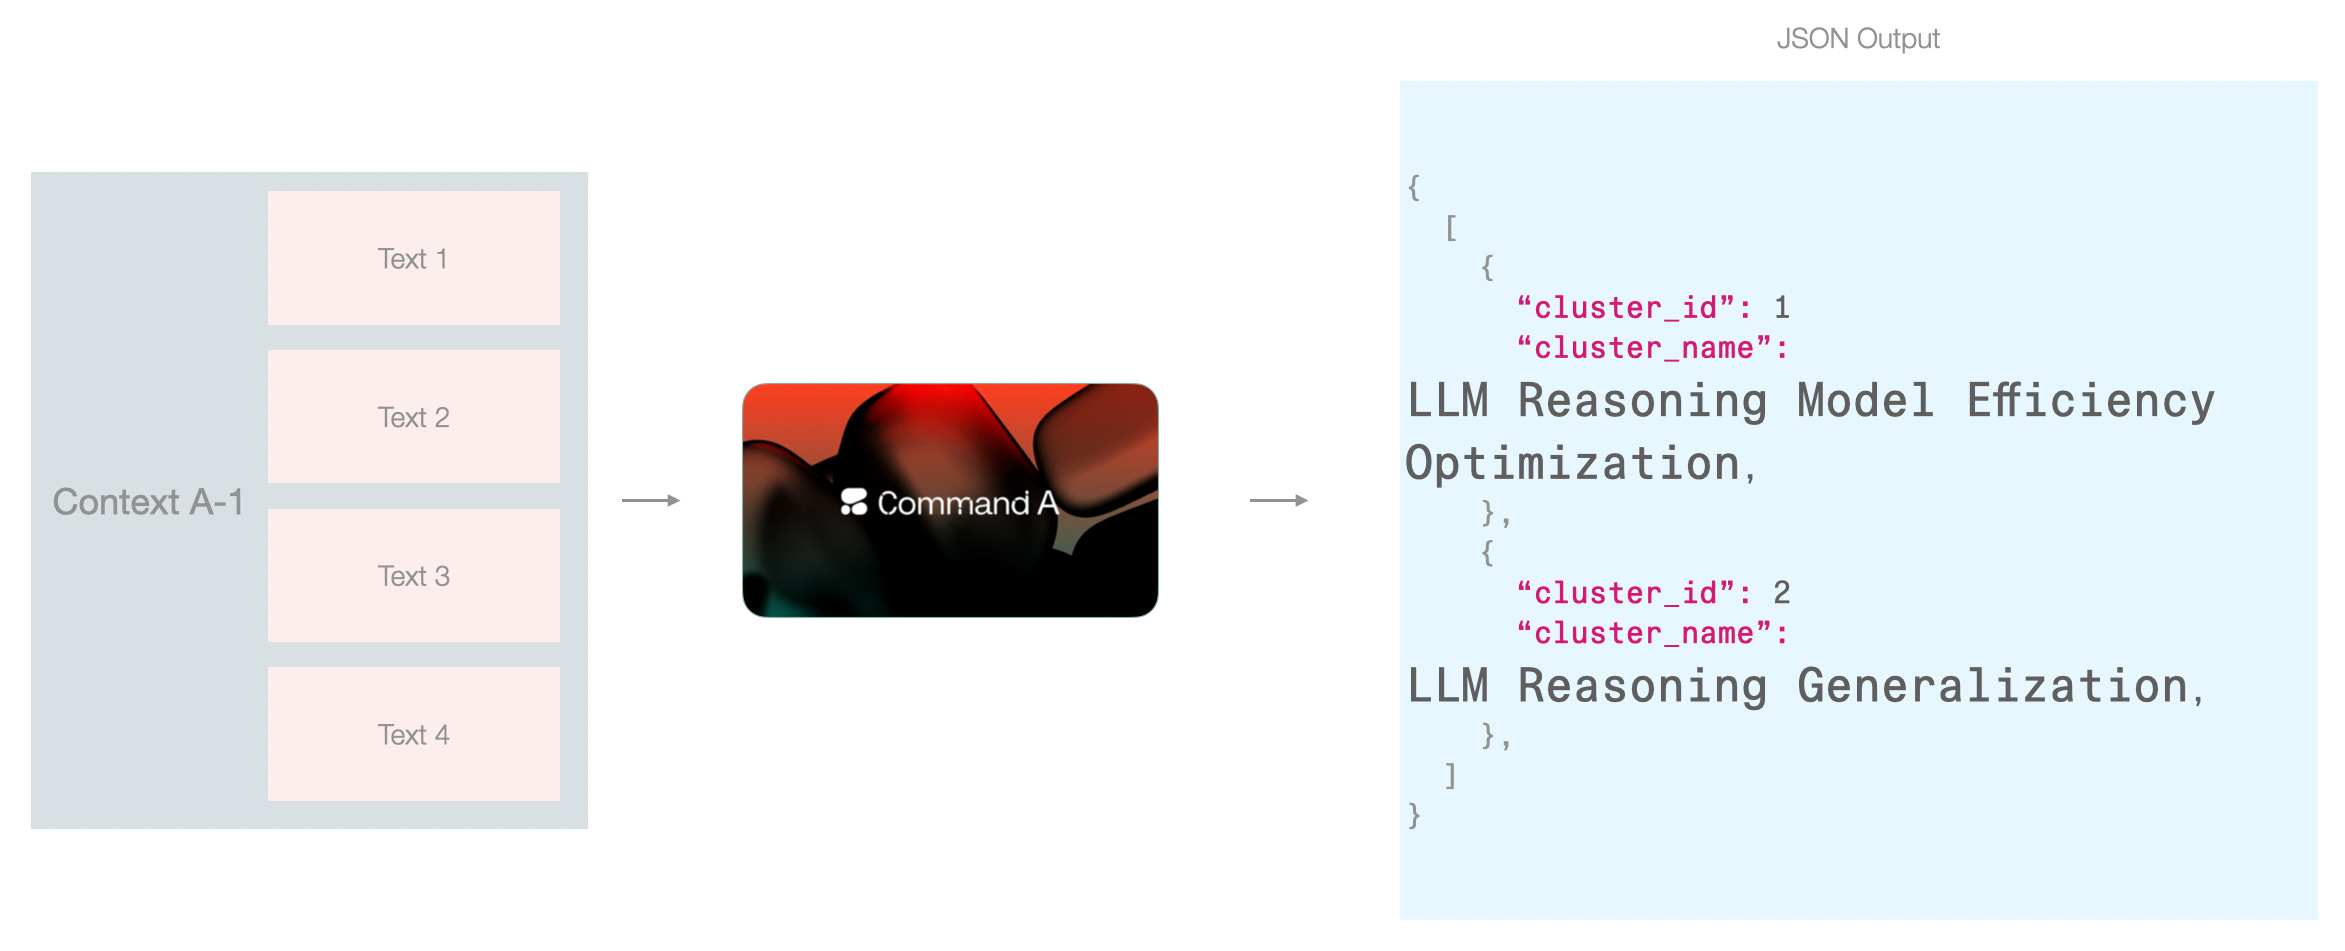
This approach can work if your data can fit in the model context. Another approach would be to do it over two steps, 1) name by looking only at the cluster, and 2) allow the model another look at the clusters after the first pass of naming.
In this pipeline, I leaned towards this approach because it fits neatly with the step of assigning a high-level cluster name (I will also refer to this as “category name”). This way, The first type of context is freed up for the model to focus on an individual cluster and not be distracted by other clusters. But this only works because in addition to the cluster_name, we’re also generating a cluster_description which contains enough details to make this context hand-off possible without overpacking the renaming step with too much information.
The shape of the prompt can look like this:
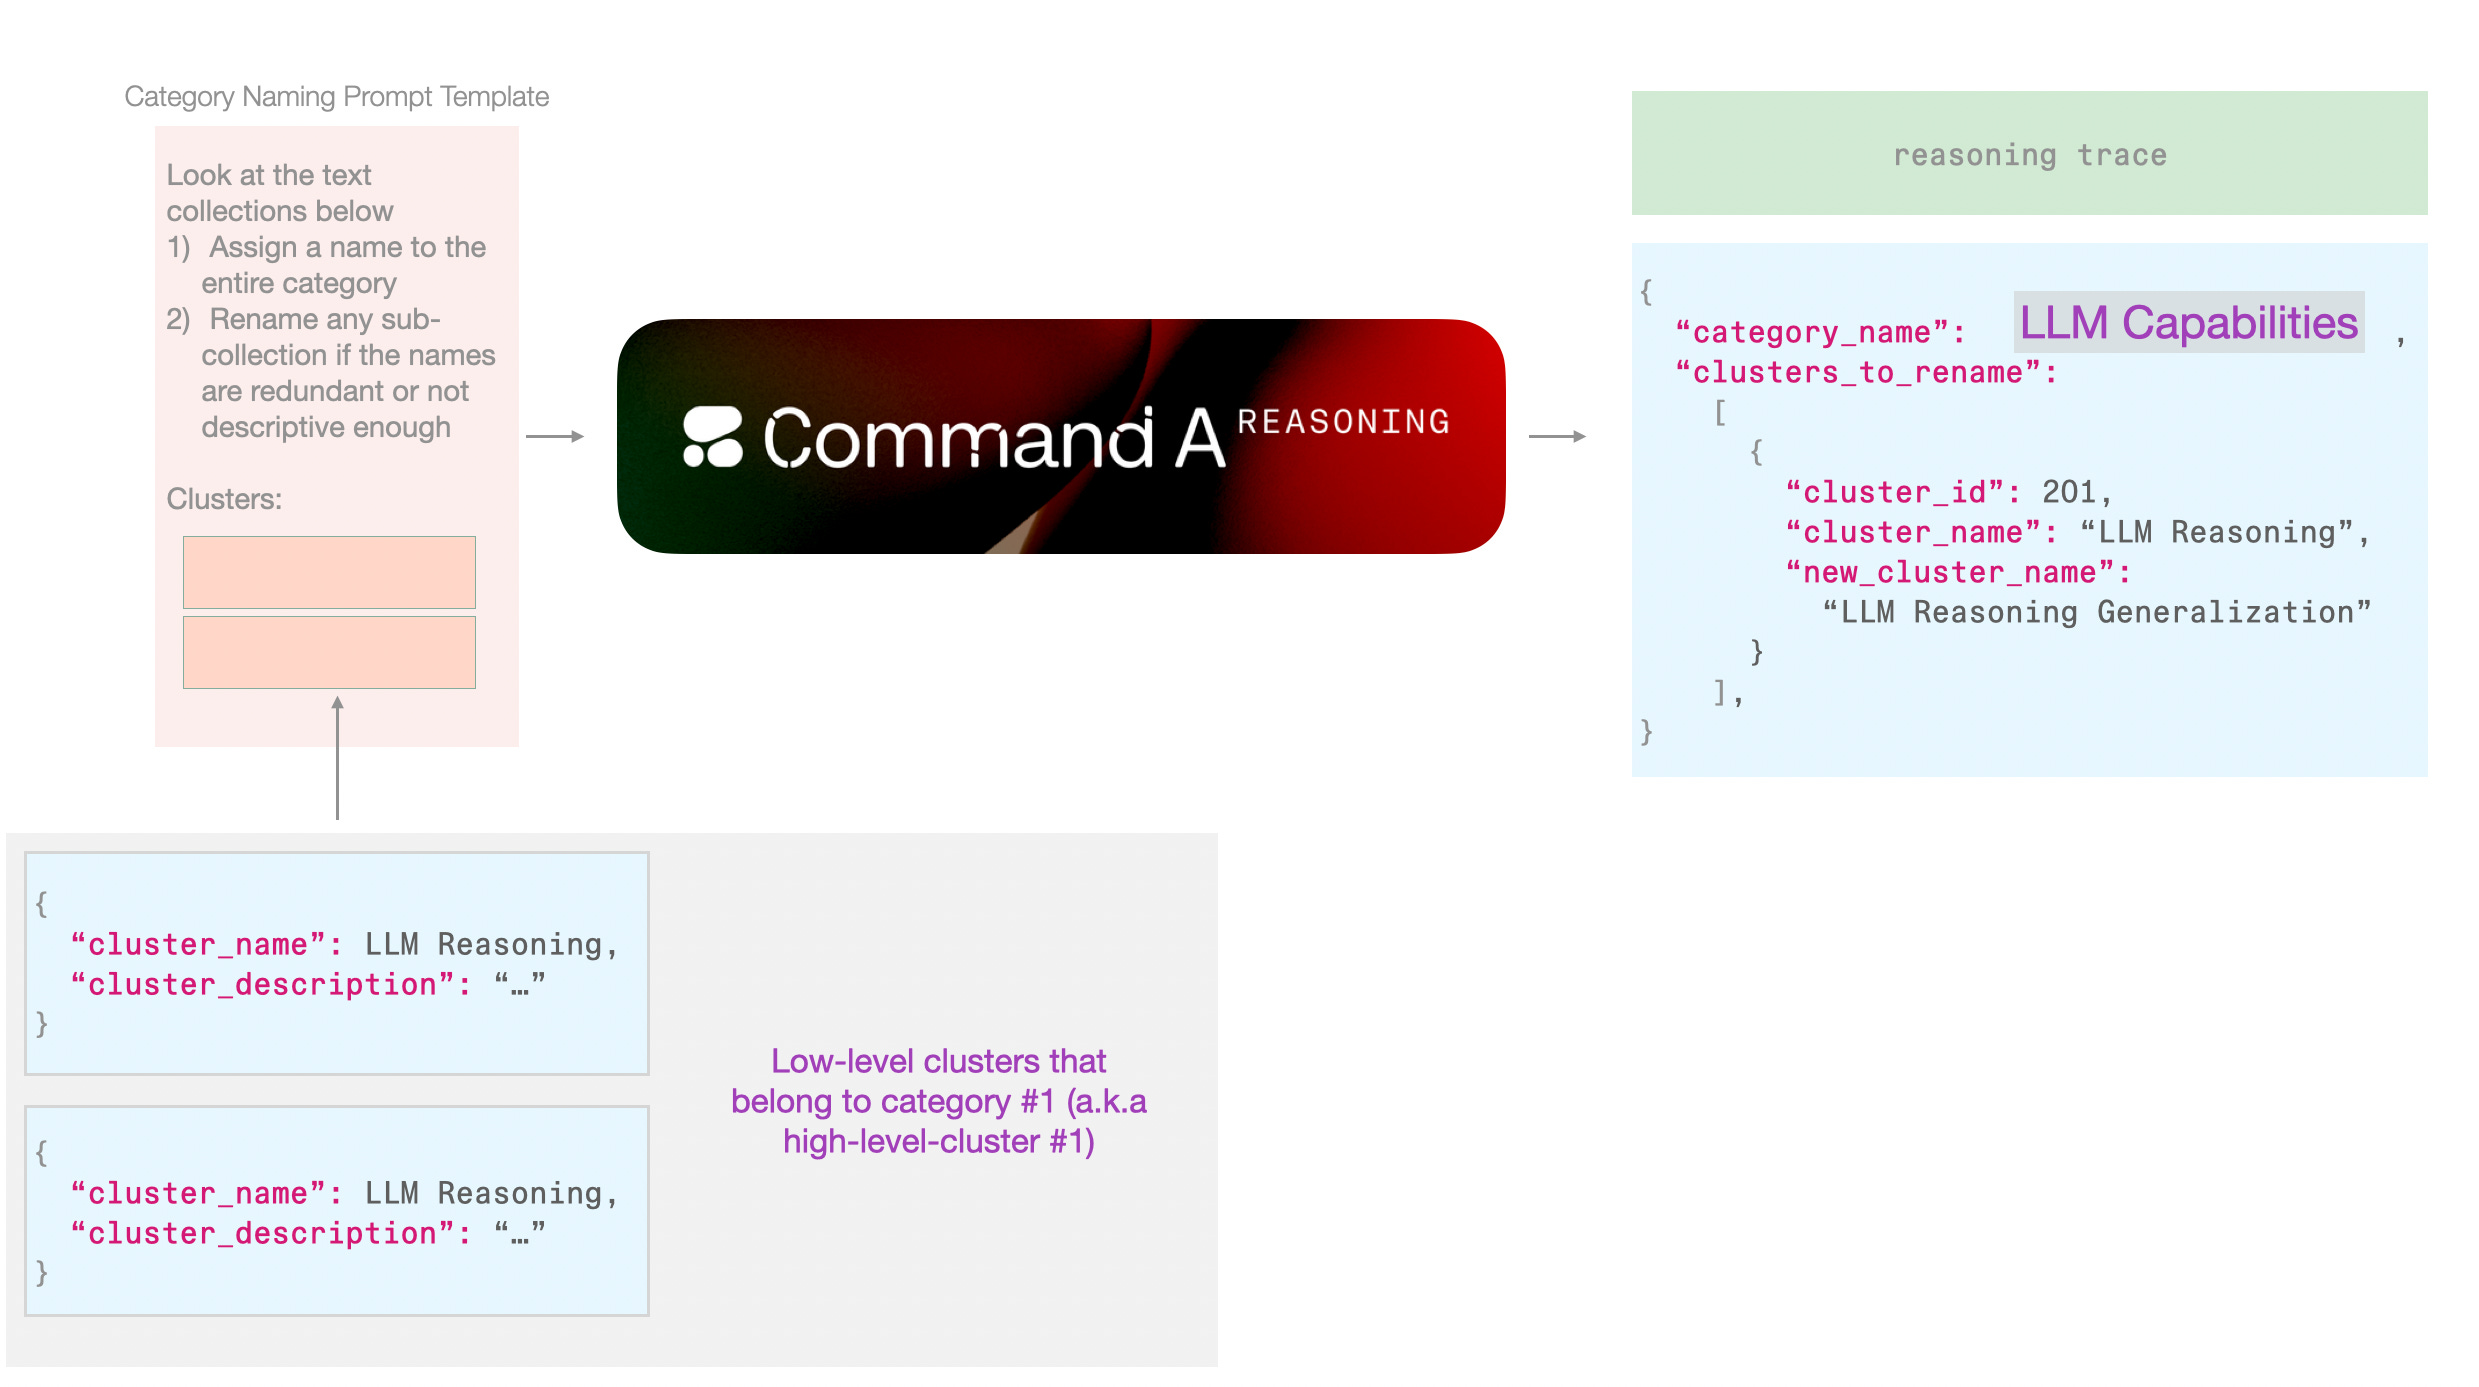
Because we are only doing a few of these calls, we can assign this to a more advanced model. We can use Command-A Reasoning here for example and allow it to reason about the names. It’s always fascinating to look at these traces. Here’s an example reasoning trace for assigning a category name:
For the high-level category name, it should encapsulate this theme. Terms like “LLM Reasoning” and “Evaluation” come to mind. Since the category is part of a larger collection of ML research, it needs to be specific. “LLM Reasoning and Evaluation” seems appropriate as it covers both the development and assessment aspects.About The Models
Command A, Command A Reasoning, and Embed 4 were released earlier in 2025. You can learn more about Command A by reading the Command A Technical Report which contains 55 pages of insights into how it was built.
Future work and limitations
This work is simply one possible pipeline and can certainly be improved. My aim is more people innovate around methods and user interfaces that empower individuals to process vast amounts of information in super-human ways.
Some areas I find need further developments include:
Better ways to automate review of the many small clusters, I was able to scan them (usually in excel), and look more closely at the large cluster names. But as things grow in the hundreds, we’ll need the aid of more tools.
Clustering workflows that better address noise. I know HDBSCAN is useful here. I often still lean towards a first K-Means step, but then disregard clusters with a few number of papers as noise, because they might not actually coherently be a part of a coherent grouping despite their semantic similarity.
UI that allows switching between different topologies, or different assignments. Datamapplot allows some of this, and I’m planning to dig deeper there.
Acknowledgements
Thanks to Adrien Morisot, Ahmet Ustun, Case Ploeg, Eugene Cho, Irem Ergun, Keith Hall, Komal Kumar Teru, Madeline Smith, Nick Frosst, Patrick Lewis, Rafid Al-Humaimidi, Sarra Habchi, Sophia Althammer, Suhas Pai, Thomas Euyang, Trent Fowler, and Varun Kumethi for feedback, thoughts, and hallway chatter about this exploration.
Have you explored such methods in the past? Please share and link in the comments!
Posting some thoughts here as we've tackled similar challenges over the years:
"Clustering workflows that better address noise. I know HDBSCAN is useful here. I often still lean towards a first K-Means step, but then disregard clusters with a few number of papers as noise, because they might not actually coherently be a part of a coherent grouping despite their semantic similarity."
I find the main issue with HBDSCAN is that areas of low density are considered noise, but often in unstructured data it's the highest density areas that are actually noise (Slop, bot spam and such). Which are virtually guaranteed to be labelled as clusters so long as there are enough nearest neighbours to satisfy the value of `min_cluster_size = `.
Conversely, kMeans assumes nothing is noise, and there is always noise.
So I prefer to run both kMeans and HDBSCAN over the data inpdendently, kMeans with a low-ish value, and then see how the HDBSCAN clusters fall within the kMeans clusters. I find it tends to be the case that:
- HDBSCAN clusters have high precision, low recall
- kMeans clusters have high recall, low precision
- ~100% of individual HDBSCAN clusters tend to fall into single kMeans clusters
- Similar HDBSCAN clusters fall into the same kMeans cluster
If we can label the HDBSCAN clusters appropriately, we should be able to use those HDBSCAN clusters to label the kMeans clusters. Eventually we end up with labelled high-level clusters/topics(kMeans) and specific cluster/subtopics (HDBSCAN).
There's still a challenge with what to do with the HDBSCAN outliers, at this point I prefer to evaluate the HDBSCAN -1 category as k-different noise categories. And then determine whether the `kmeans_cluster == 1 and hdbscan_cluster == -1` is itself clearly part of the named kmeans cluster, or whether it appears to be genuine noise. If the -1 is noisy, drop them from the kMeans cluster. Now our kMeans clusters will tend towards higher precision and lower recall.
I have created a simple browser: https://kotwic4.github.io/Neurips2025Papers/